OpenJDK JVM Deep Dive: A Comprehensive Guide to Thread Local Allocation Buffers#
1. Before We Begin#
This article is quite technical and comprehensive, covering everything from design philosophy to implementation details and source code analysis. We’ll also explore logging and monitoring approaches. If anything seems unclear or raises questions, please feel free to leave comments!
The design concepts discussed here are based on my personal understanding, and the implementation principles and source code analysis represent my own research. If you spot any inaccuracies, corrections are most welcome! Thanks in advance! 😊
2. Memory Allocation Implementation Strategy#
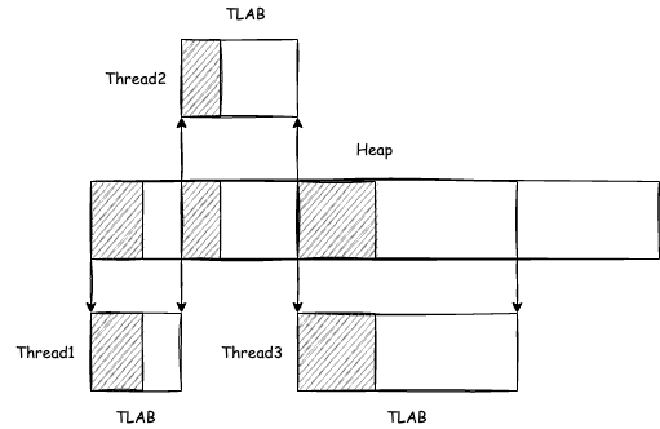
We often create new objects that require memory space. When we first allocate an object, the memory layout looks like Figure 00:
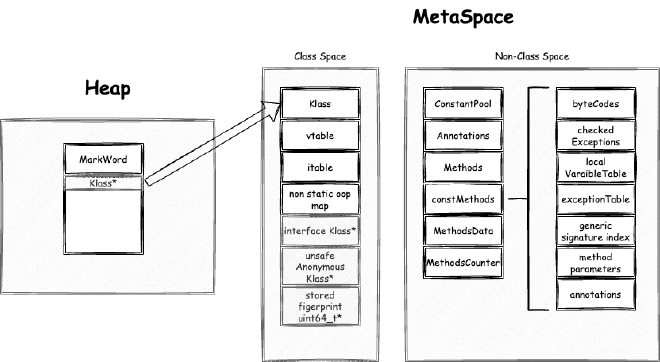
For now, let’s focus on heap storage - we’ll dive into metaspace storage in another series. Heap storage includes object headers, object bodies, and memory alignment padding. But how exactly is this space allocated?
First, the memory required for an object can be calculated before creation once the object’s class has been parsed and loaded into metaspace. If we were to design heap memory allocation ourselves, the simplest approach would be linear allocation, also known as bump-the-pointer allocation.
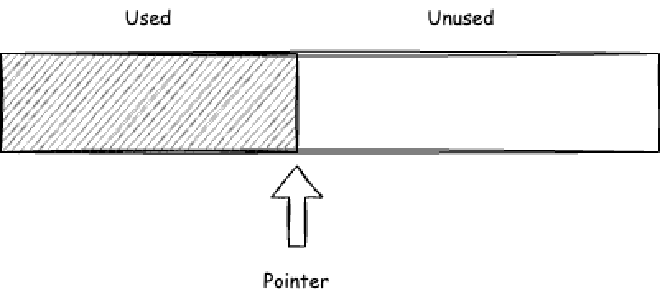
Each time we need to allocate memory, we calculate the required size and then use CAS updates to move the memory allocation pointer as shown in Figure 01, marking the allocated memory. However, memory typically isn’t this neat - some areas get allocated while others are freed and reclaimed. So we usually don’t rely solely on bump-the-pointer allocation. One approach is to add a FreeList on top of bump-the-pointer allocation.
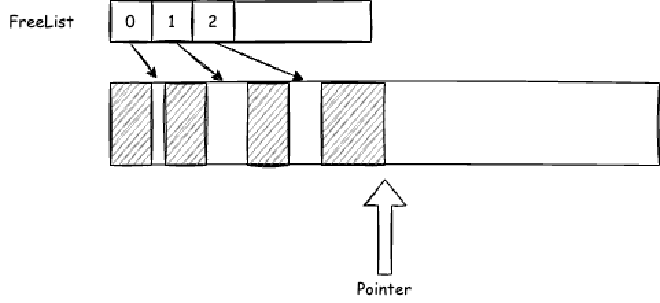
A simple implementation adds freed object memory to the FreeList. When allocating new objects, we first search the FreeList for appropriately sized memory, then fall back to bump-the-pointer allocation in main memory.
While this partially solves the problem, most modern applications are multi-threaded, making memory allocation multi-threaded too. Having all threads allocate from main memory with frequent CAS update retries leads to poor efficiency. In typical applications, different business logic uses different thread pools, and each thread’s memory allocation patterns tend to be relatively stable. By “stable,” I mean the size of objects allocated each time, the number of objects allocated within each GC cycle, and the total size.
So we could consider having each thread retain allocated memory for future use, avoiding repeated allocation from main memory. If we could estimate how much memory each thread uses within each GC cycle, we could pre-allocate memory to threads, further improving allocation efficiency. This memory allocation approach is implemented in the JVM as TLAB (Thread Local Allocation Buffer).
3. JVM Object Heap Memory Allocation Flow Overview#
We’re not considering stack allocation here - that will be covered in detail in the JIT chapters. We’re focusing on objects that cannot be stack-allocated and need to be shared.
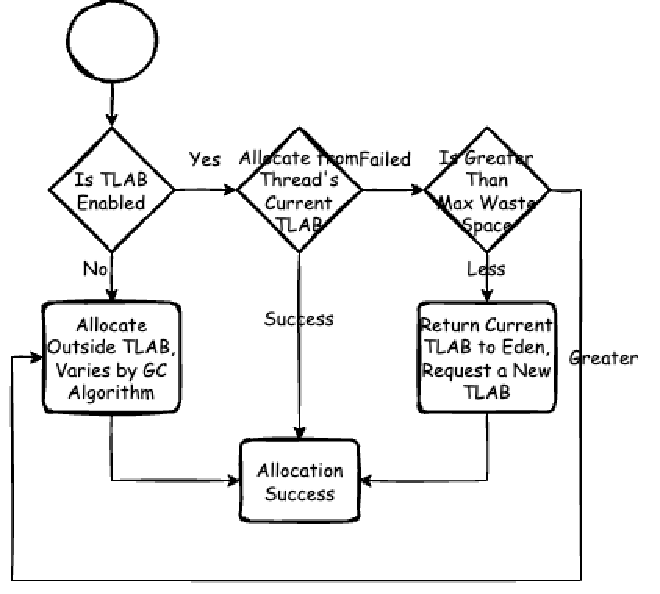
For HotSpot JVM implementation, all GC algorithms manage heap memory by implementing a heap abstraction through the CollectedHeap interface. When allocating heap memory space for an object, CollectedHeap first checks if TLAB is enabled. If so, it attempts TLAB allocation. If the current thread’s TLAB has sufficient space, allocation happens from the thread’s current TLAB. If insufficient but the current TLAB’s remaining space is less than the maximum waste limit (a dynamic value we’ll analyze in detail later), a new TLAB is requested from the heap (usually Eden region). Otherwise, allocation happens outside TLAB. Non-TLAB allocation strategies vary by GC algorithm. For example, in G1:
- If it’s a Humongous object (objects exceeding half a Region’s size), allocation happens directly in the Humongous region (contiguous old generation areas).
- Based on Mutator status, allocation happens within the current allocation index Region.
4. TLAB Lifecycle#
TLAB is thread-private. During thread initialization, TLAB is created and initialized. It’s also created and initialized during a thread’s first object allocation attempt after GC scanning.
TLAB lifecycle ends (note: lifecycle end doesn’t mean memory reclamation, just that this TLAB is no longer privately managed by this thread) when:
- Current TLAB lacks allocation space and remaining space is less than the maximum waste limit - the TLAB gets returned to Eden and a new one is requested.
- During GC, when TLAB gets reclaimed.
5. Problems TLAB Solves and Issues It Introduces#
TLAB clearly aims to minimize direct heap allocation to avoid frequent lock contention.
However, TLAB’s design introduces several considerations worth exploring.
5.1. TLAB Introduction Creates Memory Fragmentation and May Impact GC Scanning Performance#
Fragmentation occurs when:
- When current TLAB lacks allocation space and remaining space is less than the maximum waste limit, the TLAB gets returned to Eden and a new one is requested. This remaining space becomes fragmentation.
- During GC, if TLAB isn’t fully used, unallocated memory also becomes fragmentation.

Without managing this fragmentation, since only the thread knows which TLAB parts are allocated, when GC scanning occurs and the TLAB returns to Eden, external systems don’t know which parts are used versus unused without additional checks, impacting GC scanning efficiency. Therefore, when TLAB returns to Eden, remaining available space gets filled with a dummy object. If we fill with objects confirmed for reclamation (dummy objects), GC can directly mark and skip this memory, improving scanning efficiency. However, since we need to fill this dummy object, we must reserve space for this object’s header.
5.2. Thread Memory Allocation Within One GC Cycle Isn’t Stable#
If we could predict how much memory each thread will allocate in the next cycle, we could pre-allocate accordingly. But this is wishful thinking. Each thread’s allocation patterns may vary across GC cycles due to:
- Different threads handle different business scenarios, leading to varying object sizes. We typically separate thread pools by business logic for proper isolation. User requests might allocate smaller objects, while background analysis requests allocate larger ones.
- Thread pressure varies across time periods. Business has peaks and valleys - peak times definitely see more object allocation.
- Even within the same time period and thread pool, business pressure isn’t evenly distributed. Often only a few threads are busy while others remain idle.
Considering these factors, we should implement TLAB as follows:
- Don’t immediately allocate large TLABs to threads; instead, request new ones after current TLAB fills up for better flexibility.
- Each TLAB request size varies rather than being fixed.
- Each TLAB request size should consider the expected number of allocating threads in the current GC cycle.
- Each TLAB request size should consider the expected number of times all threads will refill TLABs.
6. Expectation Calculation in JVM: EMA#
When designing TLAB sizes mentioned above, we frequently refer to “expectations.” These expectations are calculated from historical data - inputting sample values and deriving latest expected values from historical samples. Not only TLAB uses this expectation calculation, but also GC, JIT, and other JVM mechanisms. Let’s examine the EMA (Exponential Moving Average) algorithm frequently used in TLAB:

EMA’s core lies in setting appropriate minimum weights. Let’s consider a scenario: first sample 100 values of 100 (we’ll ignore the first 100 samples to exclude unstable interference), then sample 50 values of 2, finally sample 50 values of 200. Let’s observe the change curves for different minimum weights.
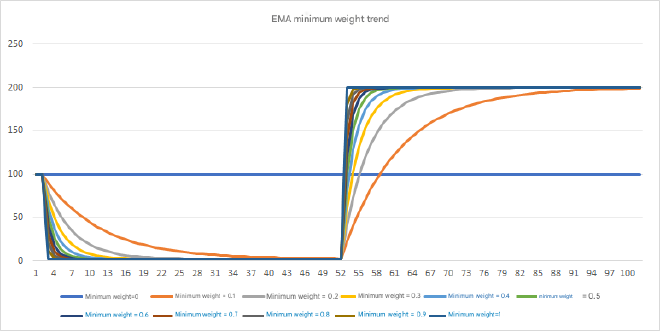
We can see that larger minimum weights lead to faster changes and less influence from historical data. Setting appropriate minimum weights based on your application can make expectations more ideal.
The corresponding source code is in gcUtil.hpp under the AdaptiveWeightedAverage class.
7. TLAB-Related JVM Parameters#
These are just listed with brief descriptions. Don’t worry if they’re unclear - we’ll provide detailed analysis later to help you understand each parameter. Once you understand them, this section becomes your reference guide! 😊 The following parameters and default values are based on OpenJDK 17
7.1. TLABStats (Deprecated)#
Deprecated since Java 12 with no related logic remaining. Previously used for TLAB statistics to better scale TLAB but had relatively high performance costs. Now mainly calculated through EMA.
7.2. UseTLAB#
Description: Whether to enable TLAB. Enabled by default.
Default: true
Example: To disable: -XX:-UseTLAB
7.3. ZeroTLAB#
Description: Whether to zero all bytes in newly created TLABs. When creating a class, fields have default values (boolean is false, int is 0, etc.), implemented by assigning 0 to allocated memory space. Setting ZeroTLAB to true means assigning 0 when TLAB is allocated, otherwise 0 is assigned during object allocation and initialization. Logically, since TLAB allocation involves Allocation Prefetch optimization for CPU cache, immediately updating to 0 after TLAB allocation should be more CPU cache-friendly. Also, if TLAB isn’t fully used, the filled dummy object is essentially a 0 array, so most doesn’t need changing. This suggests enabling should be better, but ZeroTLAB remains disabled by default.
Default: false
Example: -XX:+ZeroTLAB
7.4. ResizeTLAB#
Description: Whether TLAB is resizable. Default is yes, meaning it calculates expected TLAB size for each request based on thread historical allocation data-related EMA calculations.
Default: true
Example: To disable: -XX:-ResizeTLAB
7.5. TLABSize#
Description: Initial TLAB size in bytes.
Default: 0, meaning don’t actively set TLAB initial size but let JVM calculate each thread’s initial size.
Example: -XX:TLABSize=65536
7.6. MinTLABSize#
Description: Minimum TLAB size in bytes.
Default: 2048
Example: -XX:TLABSize=4096
7.7. TLABAllocationWeight#
Description: TLAB initial size calculation relates to thread count, but threads are dynamically created and destroyed. So we need to predict upcoming thread count based on historical thread count to calculate TLAB size. Generally, JVM prediction functions like this use EMA. This parameter is the minimum weight from Figure 06 - higher weights mean more recent data has greater impact. TLAB size recalculation is based on allocation ratio, which also uses EMA algorithm with minimum weight also being TLABAllocationWeight.
Default: 35
Example: -XX:TLABAllocationWeight=70
7.8. TLABWasteTargetPercent#
Description: TLAB size calculation involves Eden region size and allowable waste ratio. TLAB waste refers to unallocated space in old TLAB when requesting new TLAB as mentioned above. This parameter is the percentage of TLAB waste occupying Eden. This parameter’s role will be detailed in upcoming principle explanations.
Default: 1
Example: -XX:TLABWasteTargetPercent=10
7.9. TLABRefillWasteFraction#
Description: Initial maximum waste limit calculation parameter. Initial maximum waste limit = current expected TLAB size / TLABRefillWasteFraction.
Default: 64
Example: -XX:TLABRefillWasteFraction=32
7.10. TLABWasteIncrement#
Description: Maximum waste limit isn’t constant. During slow TLAB allocation (when current TLAB space is insufficient for allocation), the maximum waste limit increases. This parameter is the TLAB waste increment allowed during slow allocation. The unit isn’t bytes but MarkWord count (Java heap’s minimum memory unit). In 64-bit VMs, MarkWord size is 8 bytes.
Default: 4
Example: -XX:TLABWasteIncrement=4
8. TLAB Basic Flow#
8.0. How to Design Each Thread’s TLAB Size#
Based on previously mentioned problems and solutions introduced by TLAB, we can design TLAB as follows:
First, TLAB’s initial size should relate to the number of threads needing object allocation per GC. However, the number of allocating threads isn’t necessarily stable - there might be many threads this period and fewer the next. So we need EMA algorithm to collect the number of threads needing object allocation per GC to calculate this expected count.
Next, ideally, all memory used for object allocation within each GC should be within corresponding threads’ TLABs. Memory used for object allocation per GC is essentially Eden region size from JVM design perspective. In the most ideal situation, GC should only occur when Eden region is full, not for other reasons - this is the most efficient scenario. If Eden region is exhausted and all allocation is within TLABs, meaning Eden region is filled by all threads’ TLABs, this allocation is fastest.
Then, the number and size of threads allocating memory per GC cycle aren’t fixed. Allocating large chunks at once causes waste, while too small chunks lead to frequent TLAB requests from Eden, reducing efficiency. This size is hard to control, but we can limit how many times each thread can request TLABs from Eden within one GC cycle, making it more controllable for users.
Finally, each thread’s memory allocation size isn’t necessarily stable per GC cycle. Using only initial size to guide subsequent TLAB sizes is clearly insufficient. We can change perspective - each thread’s memory allocation relates to history, so we can predict from historical allocation. Therefore, each thread also needs EMA algorithm to collect memory allocated per GC cycle, guiding next expected TLAB size.
In summary, we get this approximate TLAB calculation formula:
Each thread’s initial TLAB size = Eden region size / (maximum TLAB requests per thread per GC cycle * current GC allocating thread count EMA)
After GC, recalculated TLAB size = Eden region size / (maximum TLAB requests per thread per GC cycle * current GC allocating thread count EMA)
Next, let’s analyze each flow in TLAB’s complete lifecycle.
8.1. TLAB Initialization#
During thread initialization, if JVM has TLAB enabled (default enabled, can be disabled with -XX:-UseTLAB), TLAB gets initialized. During object allocation, TLAB memory is requested based on expected size. Also, after GC object scanning, during a thread’s first object allocation attempt, TLAB memory is re-requested. Let’s focus on initialization first. The initialization flow is shown in Figure 08:
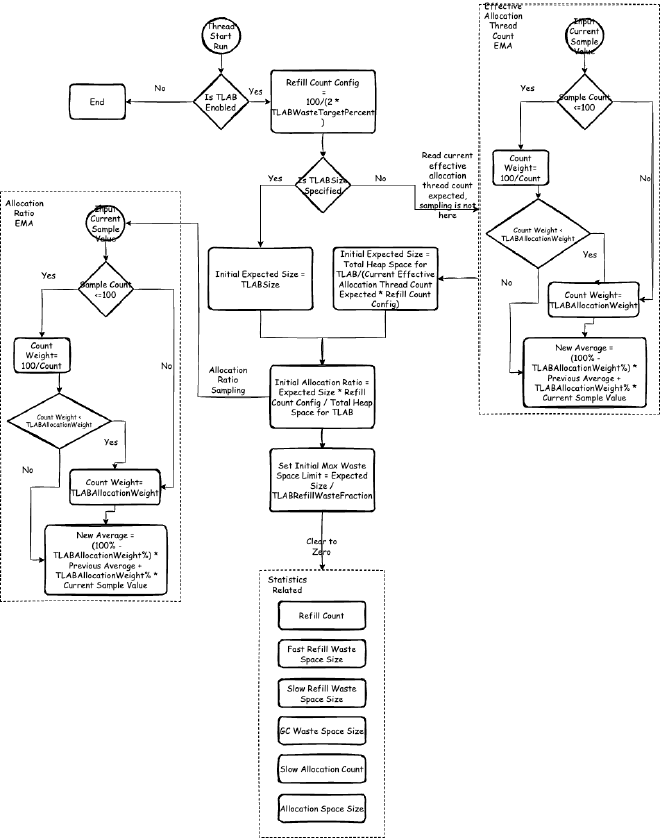
During initialization, TLAB initial expected size is calculated. This involves TLAB size limits:
- TLAB minimum size: Specified by
MinTLABSize - TLAB maximum size: Varies by GC. In G1 GC, it’s humongous object size (half of G1 region size). As mentioned earlier, in G1 GC, humongous objects cannot be allocated in TLAB but in old generation. In ZGC, it’s one-eighth of page size. Similarly, Shenandoah GC is usually one-eighth of each Region size. They all expect at least seven-eighths of the region doesn’t need returning to reduce scanning complexity when selecting Cset. For other GCs, it’s the maximum size of int arrays, related to filling dummy objects mentioned earlier, detailed in later flows.
In all subsequent flows, TLAB size will always be within the range of minimum to maximum TLAB size. To avoid repetition, we won’t emphasize this limit again!!! In all subsequent flows, TLAB size will always be within the range of minimum to maximum TLAB size. To avoid repetition, we won’t emphasize this limit again!!! In all subsequent flows, TLAB size will always be within the range of minimum to maximum TLAB size. To avoid repetition, we won’t emphasize this limit again!!! Important things said three times! 😊
TLAB expected size (desired size) is calculated during initialization and recalculated when GC operations reclaim TLAB. Based on this expected size, TLAB requests space using this expected size as baseline for TLAB allocation space.
8.1.1. TLAB Initial Expected Size Calculation#
As shown in Figure 08, if TLABSize is specified, use this size as initial expected size. If not specified, calculate using this formula:
Total heap space for TLAB / (current effective allocating thread count expectation * refill count configuration)
Total heap space for TLAB: How much heap space can be allocated to TLAB varies by GC algorithm, but most GC algorithms implement this as Eden region size. For example:
- Traditional deprecated Parallel Scavenge uses Eden region size. Reference: parallelScavengeHeap.cpp
- Default G1 GC uses (YoungList region count minus Survivor region count) * region size, essentially Eden region size. Reference: g1CollectedHeap.cpp
- ZGC uses remaining Page space size. Page is similar to Eden region where most objects are allocated. Reference: zHeap.cpp
- Shenandoah GC uses FreeSet size, also similar to Eden concept. Reference: shenandoahHeap.cpp
Current effective allocating thread count expectation: This is a global EMA. EMA was explained earlier as a way to calculate expectations. The effective allocating thread count EMA’s minimum weight is TLABAllocationWeight. Effective allocating thread count EMA is collected when threads perform first effective object allocation and read during TLAB initialization to calculate TLAB expected size.
TLAB refill count configuration (refills time): Count calculated based on TLABWasteTargetPercent using the formula. TLABWasteTargetPercent’s meaning is actually limiting maximum waste limit, why refill count relates to this will be analyzed in detail later.
8.1.2. TLAB Initial Allocation Ratio Calculation#
As shown in Figure 08, next we calculate TLAB initial allocation ratio.
Thread-private allocation ratio EMA: Corresponding to effective allocating thread count EMA, effective allocating thread count EMA describes globally how much TLAB each thread should occupy, while allocation ratio EMA provides dynamic control over total TLAB space size the current thread should occupy.
During initialization, allocation ratio equals 1/current effective allocating thread count. The formula in Figure 08, when substituted into the previous TLAB expected size calculation formula and simplified by eliminating parameters, equals 1/current effective allocating thread count. This value serves as initial value for collecting thread-private allocation ratio EMA.
8.1.3. Clear Thread-Private Statistics#
This collected data will be used for subsequent current thread allocation ratio calculation and collection, affecting future current thread TLAB expected size.
8.2. TLAB Allocation#
TLAB allocation flow is shown in Figure 09.

8.2.1. Allocate from Thread’s Current TLAB#
If TLAB is enabled (default enabled, can be disabled with -XX:-UseTLAB), first allocate memory from thread’s current TLAB. If allocation succeeds, return; otherwise, use different allocation strategies based on current TLAB remaining space versus current maximum waste limit. The next flow will explain what this limit actually is.
8.2.2. Re-request TLAB for Allocation#
If current TLAB remaining space exceeds current maximum waste limit (from Figure 08 flow, we know this initial value is expected size/TLABRefillWasteFraction), allocate directly on heap. Otherwise, re-request a new TLAB for allocation.
Why do we need maximum waste space?
When re-allocating a new TLAB, the original TLAB might still have remaining space. Before returning the original TLAB to heap, it needs to be filled with dummy objects. Since only the thread knows which TLAB parts are allocated, when GC scanning occurs and returns to Eden region, external systems don’t know which parts are used versus unused without additional checks. If filled with objects confirmed for reclamation (dummy objects), GC can directly mark and skip this memory, improving scanning efficiency. Anyway, this memory already belongs to TLAB and other threads can’t use it until next scan ends. This dummy object is an int array. To ensure space for filling dummy objects, generally TLAB size reserves space for a dummy object header, also an int[] header, so TLAB size cannot exceed int array maximum size, otherwise cannot fill unused space with dummy objects.
However, filling dummy objects also causes space waste, which can’t be excessive, so maximum waste limit controls this waste.
New TLAB size takes the smaller of these two values:
Current heap remaining space allocatable to TLAB. Most GC implementations are essentially corresponding Eden region remaining size:
- Traditional deprecated Parallel Scavenge uses Eden region remaining size. Reference: parallelScavengeHeap.cpp
- Default G1 GC uses current Region remaining size, essentially partitioned Eden. Reference: g1CollectedHeap.cpp
- ZGC uses Page remaining space size. Page is similar to Eden region where most objects are allocated. Reference: zHeap.cpp
- Shenandoah GC uses FreeSet remaining size, also similar to Eden concept. Reference: shenandoahHeap.cpp
TLAB expected size + current required allocation space size
After allocating TLAB, based on ZeroTLAB configuration, decide whether to assign 0 to each byte. When creating objects, we need to assign initial values to each field anyway, and most field initial values are 0. Also, when TLAB returns to heap, remaining space is filled with int[] arrays containing 0s. So we can pre-fill with 0s. Also, assigning 0 right after TLAB allocation can utilize Allocation prefetch mechanism to adapt to CPU cache lines (Allocation prefetch mechanism will be explained in another series), so you can enable ZeroTLAB to assign 0 immediately after allocating TLAB space.
8.2.3. Allocate Directly from Heap#
Direct heap allocation is the slowest allocation method. One case is when current TLAB remaining space exceeds current maximum waste limit, allocate directly on heap. Also, this increases current maximum waste limit - each such allocation increases by TLABWasteIncrement size. After a certain number of direct heap allocations, continuously increasing current maximum waste limit will cause current TLAB remaining space to be less than current maximum waste limit, leading to requesting new TLAB for allocation.
8.3. TLAB Reclamation and Expected Size Recalculation During GC#
Related flows are shown in Figure 10. Both before and after GC, some operations are performed on TLAB.
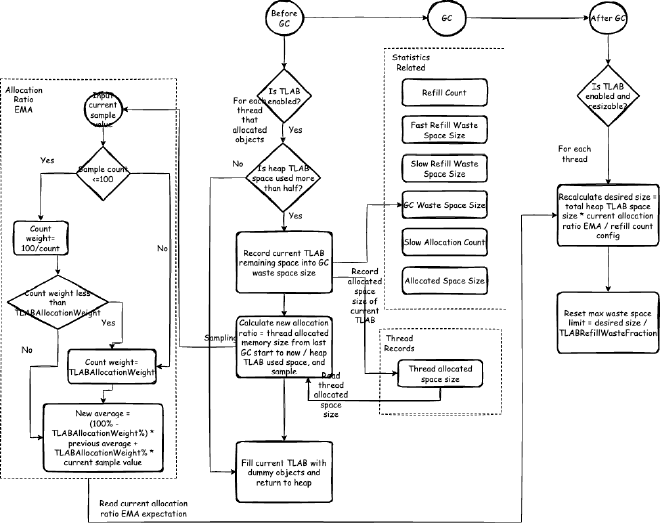
8.3.1. Pre-GC Operations#
Before GC, if TLAB is enabled (default enabled, can be disabled with -XX:-UseTLAB), all threads’ TLABs need to be filled with dummy objects and returned to heap, calculating and sampling some data for future TLAB size calculations.
First, to ensure current calculation has reference value, check if heap TLAB space usage exceeds half. If insufficient, consider current GC cycle data lacks reference value. If usage exceeds half, calculate new allocation ratio: new allocation ratio = thread’s current GC cycle allocation space size / heap space used by all threads’ TLABs. This calculation is because allocation ratio describes current thread’s proportion of total heap space allocated to TLABs, varying by thread, dynamically controlling different business threads’ TLAB sizes.
Thread’s current GC cycle allocation space size includes both TLAB and non-TLAB allocations. From Figures 8, 9, 10 flow diagrams recording thread allocation space size in thread records, we can see that reading thread allocation space size minus previous GC end thread allocation space size gives thread’s current GC cycle allocation space size.
Finally, after filling current TLAB with dummy objects, return to heap.
8.3.2. Post-GC Operations#
If TLAB is enabled (default enabled, can be disabled with -XX:-UseTLAB) and TLAB size is variable (default enabled, can be disabled with -XX:-ResizeTLAB), each thread’s TLAB expected size is recalculated after GC: new expected size = heap space for TLAB * current allocation ratio EMA / refill count configuration. Then reset maximum waste limit to current expected size / TLABRefillWasteFraction.
9. OpenJDK HotSpot TLAB Source Code Analysis#
If this section seems challenging, you can skip directly to Chapter 10, Hot Q&A, which contains many frequently asked questions.
9.1. TLAB Class Structure#
During thread initialization, if JVM has TLAB enabled (default enabled, can be disabled with -XX:-UseTLAB), TLAB gets initialized.
TLAB includes the following fields (HeapWord* can be understood as memory addresses in heap):
src/hotspot/share/gc/shared/threadLocalAllocBuffer.cpp
//Static global variables
static size_t   _max_size;                          // Maximum size of all TLABs
  static int      _reserve_for_allocation_prefetch;   // Reserved space for CPU cache optimization Allocation Prefetch, ignore for now
  static unsigned _target_refills;                    // Expected refill count per GC cycle

//Following are main TLAB constituent fields
HeapWord* _start;                              // TLAB start address, heap memory addresses represented by HeapWord*
HeapWord* _top;                                // Last allocated memory address
HeapWord* _end;                                // TLAB end address
size_t    _desired_size;                       // TLAB size including reserved space, memory sizes represented by size_t type, actual bytes divided by HeapWordSize value
size_t    _refill_waste_limit;                 // TLAB maximum waste space, remaining space insufficient allocation waste limit. When TLAB remaining space is insufficient, this value determines allocation strategy - if waste space exceeds this value, allocate directly in Eden region; if less, return current TLAB to Eden management and request new TLAB from Eden for allocation.
AdaptiveWeightedAverage _allocation_fraction;  // Current TLAB allocation ratio EMA

//Following fields we don't need to focus on much
HeapWord* _allocation_end;                    // TLAB's actual allocatable memory end address, this is _end address excluding reserved space (reserved for dummy object header space)
HeapWord* _pf_top;                            // Allocation Prefetch CPU cache optimization mechanism related parameter, ignore for now
size_t    _allocated_before_last_gc;          // Used to calculate thread's current GC cycle allocation space size from Figure 10, records thread's allocated space size at last GC
unsigned  _number_of_refills;                 // Thread allocation memory data collection related, TLAB insufficient remaining space allocation count
unsigned  _fast_refill_waste;                 // Thread allocation memory data collection related, TLAB fast allocation waste, fast allocation means direct TLAB allocation, unused in current JVM
unsigned  _slow_refill_waste;                 // Thread allocation memory data collection related, TLAB slow allocation waste, slow allocation means refilling a TLAB for allocation
unsigned  _gc_waste;                          // Thread allocation memory data collection related, gc waste
unsigned  _slow_allocations;                  // Thread allocation memory data collection related, TLAB slow allocation count
size_t    _allocated_size;                    // Allocated memory size
size_t    _bytes_since_last_sample_point;     // JVM TI metric collection related field, ignore for now
9.2. TLAB Initialization#
First, during JVM startup, global TLAB needs initialization:
src/hotspot/share/gc/shared/threadLocalAllocBuffer.cpp
void ThreadLocalAllocBuffer::startup_initialization() {
  //Initialize, i.e., zero statistics
  ThreadLocalAllocStats::initialize();

  // Assume on average, during GC scanning, each thread's current TLAB has half its memory wasted, this per-thread memory waste percentage (i.e., TLABWasteTargetPercent), equals (note: only the latest TLAB has waste, previous refilled returns assumed no waste): 1/2 * (expected refill count per thread per epoch) * 100
  //So refill count configuration per thread per epoch equals 50 / TLABWasteTargetPercent, defaulting to 50 times.
  _target_refills = 100 / (2 * TLABWasteTargetPercent);
  // But initial _target_refills needs setting to maximum 2 times to reduce GC possibility during VM initialization
  _target_refills = MAX2(_target_refills, 2U);

//If C2 JIT compilation exists and is enabled, reserve CPU cache optimization Allocation Prefetch space, ignore for now, will be covered in other chapters
#ifdef COMPILER2
  if (is_server_compilation_mode_vm()) {
    int lines =  MAX2(AllocatePrefetchLines, AllocateInstancePrefetchLines) + 2;
    _reserve_for_allocation_prefetch = (AllocatePrefetchDistance + AllocatePrefetchStepSize * lines) /
                                       (int)HeapWordSize;
  }
#endif

  // Initialize main thread's TLAB
  guarantee(Thread::current()->is_Java_thread(), "tlab initialization thread not Java thread");
  Thread::current()->tlab().initialize();
  log_develop_trace(gc, tlab)("TLAB min: " SIZE_FORMAT " initial: " SIZE_FORMAT " max: " SIZE_FORMAT,
                               min_size(), Thread::current()->tlab().initial_desired_size(), max_size());
}
Each thread maintains its own TLAB, and each thread’s TLAB size differs. TLAB size is mainly determined by Eden size, thread count, and thread object allocation rate.
When Java threads start running, TLAB is allocated first:
src/hotspot/share/runtime/thread.cpp
```cpp
void JavaThread::run() {
  // initialize thread-local alloc buffer related fields
  this->initialize_tlab();
  //remaining code omitted
}
Allocating TLAB actually calls ThreadLocalAllocBuffer’s initialize method.
src/hotspot/share/runtime/thread.hpp
void initialize_tlab() {
    //If TLAB isn't disabled via -XX:-UseTLAB, initialize TLAB
    if (UseTLAB) {
      tlab().initialize();
    }
}

// Thread-Local Allocation Buffer (TLAB) support
ThreadLocalAllocBuffer& tlab()                 {
  return _tlab;
}

ThreadLocalAllocBuffer _tlab;
ThreadLocalAllocBuffer’s initialize method initializes the various TLAB fields we care about:
src/hotspot/share/gc/shared/threadLocalAllocBuffer.cpp
void ThreadLocalAllocBuffer::initialize() {
  //Set initial pointers, since no memory allocated from Eden yet, all set to NULL
  initialize(NULL,                    // start
             NULL,                    // top
             NULL);                   // end
  //Calculate and set initial expected size
  set_desired_size(initial_desired_size());
  //Total TLAB size, different GC implementations have different TLAB capacities, generally Eden region size
  //For example G1 GC, equals (_policy->young_list_target_length() - _survivor.length()) * HeapRegion::GrainBytes, understood as young generation minus Survivor region, i.e., Eden region
  size_t capacity = Universe::heap()->tlab_capacity(thread()) / HeapWordSize;
  //Calculate this thread's TLAB expected proportion of total TLAB size
  //TLAB expected occupied size is this TLAB size multiplied by expected refill times
  float alloc_frac = desired_size() * target_refills() / (float) capacity;
  //Record for EMA calculation
  _allocation_fraction.sample(alloc_frac);
  //Calculate and set initial refill maximum waste space
  //As described in principle section, initial size is TLAB size (_desired_size) / TLABRefillWasteFraction
  set_refill_waste_limit(initial_refill_waste_limit());
  //Reset statistics
  reset_statistics();
}
9.2.1. How is Initial Expected Size Calculated?#
src/hotspot/share/gc/shared/threadLocalAllocBuffer.cpp
//Calculate initial size
size_t ThreadLocalAllocBuffer::initial_desired_size() {
  size_t init_sz = 0;
  //If TLAB size set via -XX:TLABSize, use this value as initial expected size
  //Memory occupation size represented by HeapWord count, so use TLABSize / HeapWordSize
  if (TLABSize > 0) {
    init_sz = TLABSize / HeapWordSize;
  } else {
    //Get current epoch thread count expectation, predicted via EMA as described
    unsigned int nof_threads = ThreadLocalAllocStats::allocating_threads_avg();
    //Different GC implementations have different TLAB capacities, Universe::heap()->tlab_capacity(thread()) generally Eden region size
    //For example G1 GC, equals (_policy->young_list_target_length() - _survivor.length()) * HeapRegion::GrainBytes, understood as young generation minus Survivor region, i.e., Eden region
    //Total size equals Eden region size/(current epoch expected allocating thread count * refill count configuration per thread per epoch)
    //target_refills already initialized during JVM initialization of all TLAB global configurations
    init_sz  = (Universe::heap()->tlab_capacity(thread()) / HeapWordSize) /
                      (nof_threads * target_refills());
    //Consider object alignment, get final size
    init_sz = align_object_size(init_sz);
  }
  //Keep size between min_size() and max_size()
  //min_size mainly determined by MinTLABSize
  init_sz = MIN2(MAX2(init_sz, min_size()), max_size());
  return init_sz;
}

//Minimum size determined by MinTLABSize, represented as HeapWordSize, considering object alignment, final alignment_reserve is dummy object fill header size (ignore JVM CPU cache prematch for now, will analyze in detail in other chapters).
static size_t min_size()                       {
    return align_object_size(MinTLABSize / HeapWordSize) + alignment_reserve();
}
9.2.2. How is TLAB Maximum Size Determined?#
Different GC methods have different approaches:
In G1 GC, it’s humongous object size, i.e., half of G1 region size: src/hotspot/share/gc/g1/g1CollectedHeap.cpp
// For G1 TLABs should not contain humongous objects, so the maximum TLAB size
// must be equal to the humongous object limit.
size_t G1CollectedHeap::max_tlab_size() const {
  return align_down(_humongous_object_threshold_in_words, MinObjAlignment);
}
In ZGC, it’s one-eighth of page size, similarly in most cases Shenandoah GC is also one-eighth of each Region size. They all expect at least seven-eighths of the region doesn’t need returning to reduce scanning complexity when selecting Cset:
src/hotspot/share/gc/shenandoah/shenandoahHeap.cpp
MaxTLABSizeWords = MIN2(ShenandoahElasticTLAB ? RegionSizeWords : (RegionSizeWords / 8), HumongousThresholdWords);
src/hotspot/share/gc/z/zHeap.cpp
const size_t ZObjectSizeLimitSmall = ZPageSizeSmall / 8;
For other GCs, it’s the maximum size of int arrays, related to filling dummy objects to represent TLAB empty regions. This reason was explained earlier.
9.3. TLAB Memory Allocation#
When creating a new object, we need to call instanceOop InstanceKlass::allocate_instance(TRAPS)
src/hotspot/share/oops/instanceKlass.cpp
instanceOop InstanceKlass::allocate_instance(TRAPS) {
  bool has_finalizer_flag = has_finalizer(); // Query before possible GC
  int size = size_helper();  // Query before forming handle.

  instanceOop i;

  i = (instanceOop)Universe::heap()->obj_allocate(this, size, CHECK_NULL);
  if (has_finalizer_flag && !RegisterFinalizersAtInit) {
    i = register_finalizer(i, CHECK_NULL);
  }
  return i;
}
The core is heap()->obj_allocate(this, size, CHECK_NULL) allocating memory from heap:
src/hotspot/share/gc/shared/collectedHeap.inline.hpp
inline oop CollectedHeap::obj_allocate(Klass* klass, int size, TRAPS) {
  ObjAllocator allocator(klass, size, THREAD);
  return allocator.allocate();
}
Using global ObjAllocator implementation for object memory allocation:
src/hotspot/share/gc/shared/memAllocator.cpp
oop MemAllocator::allocate() const {
  oop obj = NULL;
  {
    Allocation allocation(*this, &obj);
    //Allocate heap memory, continue to next method
    HeapWord* mem = mem_allocate(allocation);
    if (mem != NULL) {
      obj = initialize(mem);
    } else {
      // The unhandled oop detector will poison local variable obj,
      // so reset it to NULL if mem is NULL.
      obj = NULL;
    }
  }
  return obj;
}
HeapWord* MemAllocator::mem_allocate(Allocation& allocation) const {
  //If using TLAB, allocate from TLAB, continue to next method for allocation code
  if (UseTLAB) {
    HeapWord* result = allocate_inside_tlab(allocation);
    if (result != NULL) {
      return result;
    }
  }
  //Otherwise allocate directly outside tlab
  return allocate_outside_tlab(allocation);
}
HeapWord* MemAllocator::allocate_inside_tlab(Allocation& allocation) const {
  assert(UseTLAB, "should use UseTLAB");

  //Allocate memory from current thread's TLAB, TLAB fast allocation
  HeapWord* mem = _thread->tlab().allocate(_word_size);
  //If allocation succeeds, return
  if (mem != NULL) {
    return mem;
  }

  //If allocation fails, use TLAB slow allocation, need refill or allocate directly from Eden
  return allocate_inside_tlab_slow(allocation);
}
9.3.1. TLAB Fast Allocation#
src/hotspot/share/gc/shared/threadLocalAllocBuffer.inline.hpp
inline HeapWord* ThreadLocalAllocBuffer::allocate(size_t size) {
  //Verify memory pointers valid, i.e., _top within _start and _end range
  invariants();
  HeapWord* obj = top();
  //If space sufficient, allocate memory
  if (pointer_delta(end(), obj) >= size) {
    set_top(obj + size);
    invariants();
    return obj;
  }
  return NULL;
}
9.3.2. TLAB Slow Allocation#
src/hotspot/share/gc/shared/memAllocator.cpp
HeapWord* MemAllocator::allocate_inside_tlab_slow(Allocation& allocation) const {
  HeapWord* mem = NULL;
  ThreadLocalAllocBuffer& tlab = _thread->tlab();

  // If TLAB remaining space exceeds maximum waste space, record and increment maximum waste space
  if (tlab.free() > tlab.refill_waste_limit()) {
    tlab.record_slow_allocation(_word_size);
    return NULL;
  }

  //Recalculate TLAB size
  size_t new_tlab_size = tlab.compute_size(_word_size);
  //Return TLAB to Eden region
  tlab.retire_before_allocation();

  if (new_tlab_size == 0) {
    return NULL;
  }

  // Calculate minimum size
  size_t min_tlab_size = ThreadLocalAllocBuffer::compute_min_size(_word_size);
  //Allocate new TLAB space and allocate object within it
  mem = Universe::heap()->allocate_new_tlab(min_tlab_size, new_tlab_size, &allocation._allocated_tlab_size);
  if (mem == NULL) {
    assert(allocation._allocated_tlab_size == 0,
           "Allocation failed, but actual size was updated. min: " SIZE_FORMAT
           ", desired: " SIZE_FORMAT ", actual: " SIZE_FORMAT,
           min_tlab_size, new_tlab_size, allocation._allocated_tlab_size);
    return NULL;
  }
  assert(allocation._allocated_tlab_size != 0, "Allocation succeeded but actual size not updated. mem at: "
         PTR_FORMAT " min: " SIZE_FORMAT ", desired: " SIZE_FORMAT,
         p2i(mem), min_tlab_size, new_tlab_size);
  //If ZeroTLAB JVM parameter enabled, zero all object fields
  if (ZeroTLAB) {
    // ..and clear it.
    Copy::zero_to_words(mem, allocation._allocated_tlab_size);
  } else {
    // ...and zap just allocated object.
  }

  //Set new TLAB space as current thread's TLAB
  tlab.fill(mem, mem + _word_size, allocation._allocated_tlab_size);
  //Return allocated object memory address
  return mem;
}
9.3.2.1 TLAB Maximum Waste Space#
TLAB maximum waste space _refill_waste_limit initial value is TLAB size divided by TLABRefillWasteFraction:
src/hotspot/share/gc/shared/threadLocalAllocBuffer.hpp
size_t initial_refill_waste_limit() { return desired_size() / TLABRefillWasteFraction; }
Each slow allocation calls record_slow_allocation(size_t obj_size) to record slow allocation while increasing TLAB maximum waste space size:
src/hotspot/share/gc/shared/threadLocalAllocBuffer.cpp
void ThreadLocalAllocBuffer::record_slow_allocation(size_t obj_size) {
  //Each slow allocation, _refill_waste_limit increases by refill_waste_limit_increment, i.e., TLABWasteIncrement
  set_refill_waste_limit(refill_waste_limit() + refill_waste_limit_increment());
  _slow_allocations++;
  log_develop_trace(gc, tlab)("TLAB: %s thread: " INTPTR_FORMAT " [id: %2d]"
                              " obj: " SIZE_FORMAT
                              " free: " SIZE_FORMAT
                              " waste: " SIZE_FORMAT,
                              "slow", p2i(thread()), thread()->osthread()->thread_id(),
                              obj_size, free(), refill_waste_limit());
}
//refill_waste_limit_increment is JVM parameter TLABWasteIncrement
static size_t refill_waste_limit_increment()   { return TLABWasteIncrement; }
9.3.2.2. Recalculating TLAB Size#
Recalculation takes the smaller of current heap remaining space allocatable to TLAB and TLAB expected size + current required allocation space size:
src/hotspot/share/gc/shared/threadLocalAllocBuffer.inline.hpp
inline size_t ThreadLocalAllocBuffer::compute_size(size_t obj_size) {
  //Get current heap remaining space allocatable to TLAB
  const size_t available_size = Universe::heap()->unsafe_max_tlab_alloc(thread()) / HeapWordSize;
  //Take smaller of TLAB allocatable space and TLAB expected size + current required allocation space size and TLAB maximum size
  size_t new_tlab_size = MIN3(available_size, desired_size() + align_object_size(obj_size), max_size());

  // Ensure size greater than dummy obj header
  if (new_tlab_size < compute_min_size(obj_size)) {
    log_trace(gc, tlab)("ThreadLocalAllocBuffer::compute_size(" SIZE_FORMAT ") returns failure",
                        obj_size);
    return 0;
  }
  log_trace(gc, tlab)("ThreadLocalAllocBuffer::compute_size(" SIZE_FORMAT ") returns " SIZE_FORMAT,
                      obj_size, new_tlab_size);
  return new_tlab_size;
}
9.3.2.3. Returning Current TLAB to Heap#
src/hotspot/share/gc/shared/threadLocalAllocBuffer.cpp
//Called in TLAB slow allocation, return current TLAB to heap
void ThreadLocalAllocBuffer::retire_before_allocation() {
  //Add current TLAB remaining space size to slow allocation waste space size
  _slow_refill_waste += (unsigned int)remaining();
  //Execute TLAB return to heap, this will also be called during GC to return all threads' TLABs to heap
  retire();
}

//For TLAB slow allocation, stats is null
//For GC calls, stats records each thread's data
void ThreadLocalAllocBuffer::retire(ThreadLocalAllocStats* stats) {

  if (stats != NULL) {
    accumulate_and_reset_statistics(stats);
  }
  //If current TLAB valid
  if (end() != NULL) {
    invariants();
    //Record used space in thread allocation object size record
    thread()->incr_allocated_bytes(used_bytes());
    //Fill dummy object
    insert_filler();
    //Clear current TLAB pointers
    initialize(NULL, NULL, NULL);
  }
}
9.4. GC-Related TLAB Operations#
9.4.1. Before GC#
Different GCs may implement differently, but TLAB operation timing is basically the same. Here’s G1 GC as example, before actual GC:
src/hotspot/share/gc/g1/g1CollectedHeap.cpp
void G1CollectedHeap::gc_prologue(bool full) {
  //omit other code

  // Fill TLAB's and such
  {
    Ticks start = Ticks::now();
    //Ensure heap memory is parsable
    ensure_parsability(true);
    Tickspan dt = Ticks::now() - start;
    phase_times()->record_prepare_tlab_time_ms(dt.seconds() * MILLIUNITS);
  }
  //omit other code
}
Why ensure heap memory is parsable? This facilitates faster scanning of heap objects. What does ensuring memory parsability do? It mainly returns each thread’s TLAB and fills dummy objects.
src/hotspot/share/gc/g1/g1CollectedHeap.cpp
void CollectedHeap::ensure_parsability(bool retire_tlabs) {
  //Real GC definitely occurs at safepoints, detailed in later safepoint chapters
  assert(SafepointSynchronize::is_at_safepoint() || !is_init_completed(),
         "Should only be called at a safepoint or at start-up");

  ThreadLocalAllocStats stats;
  for (JavaThreadIteratorWithHandle jtiwh; JavaThread *thread = jtiwh.next();) {
    BarrierSet::barrier_set()->make_parsable(thread);
    //If TLAB globally enabled
    if (UseTLAB) {
      //If specified to reclaim, reclaim TLAB
      if (retire_tlabs) {
        //Reclaim TLAB, calls retire method mentioned in 9.3.2.3. Returning Current TLAB to Heap
        thread->tlab().retire(&stats);
      } else {
        //If not reclaiming currently, fill TLAB with Dummy Object for easier parsing
        thread->tlab().make_parsable();
      }
    }
  }

  stats.publish();
}
9.4.2. After GC#
Different GCs may implement differently, but TLAB operation timing is basically the same. Here’s G1 GC as example, after GC:
src/hotspot/share/gc/g1/g1CollectedHeap.cpp
When does _desired_size change? How does it change?
void G1CollectedHeap::gc_epilogue(bool full) {
    //omit other code
    resize_all_tlabs();
}
src/hotspot/share/gc/shared/collectedHeap.cpp
void CollectedHeap::resize_all_tlabs() {
  //Need to be at safepoint, GC will be at safepoint
  assert(SafepointSynchronize::is_at_safepoint() || !is_init_completed(),
         "Should only resize tlabs at safepoint");
  //If both UseTLAB and ResizeTLAB are enabled (default enabled)
  if (UseTLAB && ResizeTLAB) {
    for (JavaThreadIteratorWithHandle jtiwh; JavaThread *thread = jtiwh.next(); ) {
      //Recalculate each thread's TLAB expected size
      thread->tlab().resize();
    }
  }
}
Recalculating each thread’s TLAB expected size:
src/hotspot/share/gc/shared/threadLocalAllocBuffer.cpp
void ThreadLocalAllocBuffer::resize() {
  assert(ResizeTLAB, "Should not call this otherwise");
  //Based on _allocation_fraction EMA collected average multiplied by Eden region size, get TLAB current predicted occupied memory ratio
  size_t alloc = (size_t)(_allocation_fraction.average() *
                          (Universe::heap()->tlab_capacity(thread()) / HeapWordSize));
  //Divide by target refill count to get new TLAB size, similar to initialization calculation method
  size_t new_size = alloc / _target_refills;
  //Ensure between min_size and max_size
  new_size = clamp(new_size, min_size(), max_size());

  size_t aligned_new_size = align_object_size(new_size);

  log_trace(gc, tlab)("TLAB new size: thread: " INTPTR_FORMAT " [id: %2d]"
                      " refills %d  alloc: %8.6f desired_size: " SIZE_FORMAT " -> " SIZE_FORMAT,
                      p2i(thread()), thread()->osthread()->thread_id(),
                      _target_refills, _allocation_fraction.average(), desired_size(), aligned_new_size);
  //Set new TLAB size
  set_desired_size(aligned_new_size);
  //Reset TLAB maximum waste space
  set_refill_waste_limit(initial_refill_waste_limit());
}
10. TLAB Flow Common Questions Q&A#
I’ll keep updating this section to address various questions
10.1. Why does TLAB need to fill dummy objects when returning to heap?#
Mainly to ensure efficient GC scanning. Since only the thread knows which TLAB parts are allocated, when GC scanning occurs and returns to Eden region, external systems don’t know which parts are used versus unused without additional checks. If filled with objects confirmed for reclamation (dummy objects), GC can directly mark and skip this memory, improving scanning efficiency. Anyway, this memory already belongs to TLAB and other threads can’t use it until next scan ends. This dummy object is an int array. To ensure space for filling dummy objects, generally TLAB size reserves space for a dummy object header, also an int[] header, so TLAB size cannot exceed int array maximum size, otherwise cannot fill unused space with dummy objects.
10.2. Why does TLAB need maximum waste space limit?#
When re-allocating a new TLAB, the original TLAB might still have remaining space. Before returning the original TLAB to heap, it needs to be filled with dummy objects. This causes this memory to be unallocatable for objects, hence called “waste.” Without limits, encountering insufficient TLAB remaining space would trigger re-requests, reducing allocation efficiency with most space filled by dummy objects, causing more frequent GC.
10.3. Why does TLAB refill count configuration equal 100 / (2 * TLABWasteTargetPercent)?#
TLABWasteTargetPercent describes initial maximum waste space configuration’s proportion of TLAB.
First, the most ideal situation is having all objects allocated within TLAB, meaning TLAB might need to fill Eden.
Before next GC scan, memory returned to Eden can’t be used by other threads because remaining space is filled with dummy objects. So all threads’ memory usage is expected allocating thread count for next epoch * refill count configuration per thread per epoch. Objects are generally allocated by some thread in Eden region, so all threads’ memory usage should ideally be the entire Eden. But this situation is too ideal - there will always be memory wasted by filling dummy objects because GC scanning can happen anytime. Assume on average, during GC scanning, each thread’s current TLAB has half its memory wasted, this per-thread memory waste percentage (i.e., TLABWasteTargetPercent), equals (note: only the latest TLAB has waste, previous refilled returns assumed no waste):
1/2 * (expected refill count per thread per epoch) * 100
So refill count configuration per thread per epoch equals 50 / TLABWasteTargetPercent, defaulting to 50 times.
10.4. Why consider ZeroTLAB?#
After allocating TLAB, based on ZeroTLAB configuration, decide whether to assign 0 to each byte. When requesting TLAB, since TLAB requests occur during object allocation, this memory will be immediately used and modified/assigned. Operating memory involves CPU cache lines, and in multi-core environments, also involves CPU cache line false sharing. For optimization, JVM implements Allocation Prefetch here - simply understood as loading this memory to CPU cache when allocating TLAB, meaning modifying memory is most efficient when allocating TLAB memory.
When creating objects, we need to assign initial values to each field anyway, and most field initial values are 0. Also, when TLAB returns to heap, remaining space is filled with int[] arrays containing 0s.
So assigning 0 right after TLAB allocation avoids subsequent 0 assignments and can utilize Allocation prefetch mechanism to adapt to CPU cache lines (Allocation prefetch mechanism details will be explained in another series).
10.5. Why does JVM need warm-up, why does Java code run faster over time? (Only TLAB-related reasons here; JIT, MetaSpace, GC, etc. will be covered in other series)#
Based on previous analysis, each thread’s TLAB size changes according to thread allocation characteristics and gradually stabilizes. Size is mainly determined by allocation ratio EMA, but this collection requires certain execution times. Also, EMA’s first 100 collections are considered unstable by default, so TLAB size changes frequently during program startup. When program threads stabilize and run for some time, each thread’s TLAB size also stabilizes and adjusts to sizes most suitable for that thread’s object allocation characteristics. This gets closer to the ideal situation where GC only occurs when Eden region is full, with all Eden region objects allocated through TLAB for efficient allocation. This is why Java code runs faster over time from a TLAB perspective.
11. TLAB-Related JVM Log Analysis#
11.1. Preparing Java WhiteBox API#
First, we need to prepare Java WhiteBox API.
11.1.1. What is WhiteBox API?#
WhiteBox API is HotSpot VM’s built-in white-box testing tool that exposes many internal core mechanism APIs for white-box testing JVM, stress testing JVM features, and assisting in learning, understanding JVM, and tuning parameters. WhiteBox API was introduced in Java 7 and is available in current Java 8 LTS and Java 11 LTS (actually all versions after Java 9+, focusing only on LTS versions here; Java 9 introduced modularity so WhiteBox API changed somewhat). However, this API isn’t compiled into JDK by default, but its implementation is compiled into JDK. So if you want to use this API, users need to compile the needed API themselves and add it to Java’s BootClassPath and enable WhiteBox API.
11.1.2. How WhiteBox API is Implemented#
WhiteBox API is a Java class located in JDK’s test package, not compiled into standard JDK distribution by default.
test/lib/sun/hotspot/WhiteBox.java
package sun.hotspot;
public class WhiteBox {
  //Just two examples, omitting other APIs and code
  // Force Young GC
  public native void youngGC();
  // Force Full GC
  public native void fullGC();
}
We can see all APIs inside are JNI calls, with specific implementation in:
src/hotspot/share/prims/whitebox.cpp
WB_ENTRY(void, WB_FullGC(JNIEnv* env, jobject o))
  Universe::heap()->soft_ref_policy()->set_should_clear_all_soft_refs(true);
  Universe::heap()->collect(GCCause::_wb_full_gc);
#if INCLUDE_G1GC
  if (UseG1GC) {
    // Needs to be cleared explicitly for G1
    Universe::heap()->soft_ref_policy()->set_should_clear_all_soft_refs(false);
  }
#endif // INCLUDE_G1GC
WB_END

WB_ENTRY(void, WB_YoungGC(JNIEnv* env, jobject o))
  Universe::heap()->collect(GCCause::_wb_young_gc);
WB_END

{CC"youngGC",  CC"()V",                             (void*)&WB_YoungGC },
{CC"fullGC",   CC"()V",                             (void*)&WB_FullGC },

//omitting other code
As we can see, JNI call implementations directly invoke underlying JVM interfaces, essentially exposing some key JVM mechanisms for white-box testing. But as mentioned earlier, JDK distributions don’t include test code, meaning the jar package containing WhiteBox API isn’t included in default JDK. This requires us to compile this code ourselves.
11.1.3. What is BootClassPath?#
Java has three different classloaders: application classloader, extension classloader, and bootstrap classloader.
- Application classloader loads all class files in our classpath directory
- Extension classloader loads extended classes of standard Java class libraries, all classes in your jre directory’s /lib/ext directory
- Bootstrap classloader scans BootClassPath for standard Java class library classloader. Standard Java class libraries restrict classes in certain package paths that must be loaded through bootstrap classloader.
For WhiteBox API, since its package is sun.hotspot, ordinary classloaders cannot load classes in this package path - they need loading through bootstrap classloader.
11.1.4. How to Specify BootClassPath#
In Java 8, specify through -Xbootclasspath: or -Xbootclasspath/p:, for example:
-Xbootclasspath:/home/project/whitebox.jar
-Xbootclasspath/p:/home/project/whitebox.jar
In Java 9+ versions, these two parameters are deprecated and need changing to -Xbootclasspath/a:, for example:
-Xbootclasspath/a:/home/project/whitebox.jar
Otherwise you’ll get error -Xbootclasspath is no longer a supported option.
The corresponding JDK source code is:
src/hotspot/share/runtime/arguments.cpp
// -bootclasspath:
} else if (match_option(option, "-Xbootclasspath:", &tail)) {
    jio_fprintf(defaultStream::output_stream(),
      "-Xbootclasspath is no longer a supported option.\n");
    return JNI_EINVAL;
// -bootclasspath/a:
} else if (match_option(option, "-Xbootclasspath/a:", &tail)) {
  //Add parameter to bootclasspath
  Arguments::append_sysclasspath(tail);
// -bootclasspath/p:
} else if (match_option(option, "-Xbootclasspath/p:", &tail)) {
    jio_fprintf(defaultStream::output_stream(),
      "-Xbootclasspath/p is no longer a supported option.\n");
    return JNI_EINVAL;
}
11.1.5. Using WhiteBox API#
1. Compile WhiteBox API
Extract the sun directory from https://github.com/openjdk/jdk/tree/master/test/lib path and compile it into a jar package, let’s call it whitebox.jar.
2. Write Test Program
Add whitebox.jar to your project dependencies, then write code:
public static void main(String[] args) throws Exception {
        WhiteBox whiteBox = WhiteBox.getWhiteBox();
        //Get ReservedCodeCacheSize JVM flag value
        Long reservedCodeCacheSize = whiteBox.getUintxVMFlag("ReservedCodeCacheSize");
        System.out.println(reservedCodeCacheSize);
        //Print heap memory metrics
        whiteBox.printHeapSizes();
        //Execute full GC
        whiteBox.fullGC();

        //Keep process from exiting to ensure complete log output
        Thread.currentThread().join();
}
3. Start Program to See Effects
Use startup parameters -Xbootclasspath/a:/home/project/whitebox.jar -XX:+UnlockDiagnosticVMOptions -XX:+WhiteBoxAPI -Xlog:gc to start the program. The first three flags enable WhiteBox API, the last one prints GC info level logs to console.
My output:
[0.025s][info][gc] Using G1
251658240
Minimum heap 8388608 Initial heap 268435456 Maximum heap 4276092928 Space alignment 2097152 Heap alignment 2097152
[0.899s][info][gc] GC(0) Pause Full (WhiteBox Initiated Full GC) 5M->0M(20M) 45.183ms
With this, we’ve prepared the WhiteBox debugging environment.
11.2. Testing TLAB and Viewing Logs#
Write test code:
//Byte array object header occupies 16 bytes
private static final int BYTE_ARRAY_OVERHEAD = 16;
//Object size we want to test is 100kb
private static final int OBJECT_SIZE = 100 * 1024;
//Need to use static field, not local variables in methods, otherwise all new byte[] in loops after compilation will be omitted, leaving only the last one
public static byte[] tmp;

public static void main(String[] args) throws Exception {
        WhiteBox whiteBox = WhiteBox.getWhiteBox();
        //Force fullGC to prevent subsequent program GC
        //Also can distinguish TLAB-related logs from other threads during initialization
        whiteBox.fullGC();
        //Allocate objects, size 1KB
        for (int i = 1; i < 512; ++i) {
            tmp = new byte[OBJECT_SIZE - BYTE_ARRAY_OVERHEAD];
        }
        //Force fullGC, reclaim all TLABs
        whiteBox.fullGC();
        //Allocate objects, size 100KB
        for (int i = 1; i < 500; ++i) {
            tmp = new byte[OBJECT_SIZE * 100 - BYTE_ARRAY_OVERHEAD];
        }
        whiteBox.fullGC();
        //Block program to ensure all logs output
        Thread.currentThread().join();
    }
Next, we start this program with the following startup parameters (first three startup parameters are needed for enabling WhiteBox API as mentioned in previous sections) to view logs (for log configuration, please refer to previous sections).
-Xbootclasspath/a:./jdk-white-box-17.0-SNAPSHOT.jar
-XX:+UnlockDiagnosticVMOptions
-XX:+WhiteBoxAPI
-Xms512m
-Xmx512m
-XX:+UseTLAB
-Xlog:gc+tlab=trace
-Xlog:gc
We can see logs similar to below. Let’s analyze them based on the code. First, all logs before the first fullGC ends. Initially, JVM startup outputs which GC is being used - here it’s default G1:
[0.022s][info][gc] Using G1
It also outputs TLAB general configuration:
[0.030s][trace][gc,tlab] TLAB min: 328 initial: 60293 max: 65536
This means TLAB minimum is 328 MarkWordSize, initial is 60293 MarkWordSize, maximum is 65536 MarkWordSize. Default 64-bit JVM MarkWordSize is 8 bytes, meaning heap memory is 8-byte aligned.
Then, since JVM startup initializes many threads by default, including:
- main thread: Thread executing main method
- Attach listener thread: Responsible for receiving external commands, executing them, and returning results to senders. Usually we use commands to request JVM feedback like: java -version, jmap, jstack, etc. If this thread isn’t initialized at JVM startup, it starts when users first execute jvm commands.
- Signal Dispatcher thread: After Attach Listener thread successfully receives external jvm commands, it hands them to signal dispatcher thread for distribution to different modules for command processing and result return. Signal dispatcher thread also initializes when first receiving external jvm commands.
- Reference Handler thread: JVM creates Reference Handler thread after creating main thread, mainly for handling garbage collection of reference objects themselves (soft references, weak references, phantom references).
- Finalizer thread: This thread is also created after main thread, mainly for calling objects’ finalize() methods before garbage collection.
- DestroyJavaVM thread: Thread executing main() calls jni_DestroyJavaVM() method in JNI after main execution completes to wake DestroyJavaVM thread, which destroys the virtual machine after all other non-daemon threads in the virtual machine end.
During runtime, depending on your JIT compilation configuration and GC parameters, there will also be:
- CompilerThread threads: JIT compilation related threads, mainly responsible for C1 C2 just-in-time compilation and OSR (On Stack Replacement) tasks
- GC related threads: Threads executing GC tasks
Besides these, after Java 8, ForkJoinPool also creates a default thread pool sized cpu cores - 1: CommonForkJoinPool, used to process ParallelStream’s default thread pool and Future framework CompletableFuture’s default thread pool.
Some of these threads will create objects during JVM initialization, which will definitely involve TLAB, so we have logs like:
[0.042s][trace][gc,tlab] ThreadLocalAllocBuffer::compute_size(2) returns 65536
[0.042s][trace][gc,tlab] TLAB: fill thread: 0x000002a66a471710 [id: 12916] desired_size: 512KB slow allocs: 0  refill waste: 8192B alloc: 1.00000     1024KB refills: 1 waste  0.0% gc: 0B slow: 0B fast: 0B
[0.155s][trace][gc,tlab] ThreadLocalAllocBuffer::compute_size(25) returns 65536
[0.155s][trace][gc,tlab] TLAB: fill thread: 0x000002a60028e900 [id: 15380] desired_size: 512KB slow allocs: 0  refill waste: 8192B alloc: 1.00000     1024KB refills: 1 waste  0.0% gc: 0B slow: 0B fast: 0B
[0.340s][trace][gc,tlab] ThreadLocalAllocBuffer::compute_size(2) returns 256
[0.340s][trace][gc,tlab] TLAB: fill thread: 0x000002a66a471710 [id: 12916] desired_size: 512KB slow allocs: 0  refill waste: 8192B alloc: 1.00000     2048KB refills: 2 waste  0.1% gc: 0B slow: 576B fast: 0B

//Omitting other threads' TLAB logs, here 23480 is Main thread. Readers can determine which is Main thread by TLAB logs of threads executing loop object allocation in program output logs
Among these, [0.042s][trace][gc,tlab] ThreadLocalAllocBuffer::compute_size(2) returns 65536 corresponds to calling compute_size to calculate initial TLAB size. The input 2 is the size needed for current thread’s allocated object (MarkWordSize), calculating initial size as 65536. Since MarkWordSize = 8, that’s 65536*8=524288 bytes, i.e., 512 KB. The next log line represents this thread initially requesting a memory block as TLAB: [0.042s][trace][gc,tlab] TLAB: fill thread: 0x000002a66a471710 [id: 12916] desired_size: 512KB slow allocs: 0 refill waste: 8192B alloc: 1.00000 1024KB refills: 1 waste 0.0% gc: 0B slow: 0B fast: 0B. This TLAB’s information includes:
- Thread number
0x000002a66a471710 [id: 12916] - Expected size, just calculated 512KB:
desired_size: 512KB - Slow allocation count, allocations not directly in current TLAB:
slow allocs: 0 - Current waste space limit, maximum waste size limit for re-requesting TLAB, refill waste: 8192B, meaning maximum 8192 bytes can be wasted
- Current _allocation_fraction related info,
alloc: 1.00000 1024KB, representing current _allocation_fraction is 1.00000, TLAB used 1024 KB total - Refills count for re-requesting TLAB:
refills: 1 - Waste ratio:
waste 0.0% - GC reclamation caused waste size:
gc: 0B - Slow
refillcaused waste:slow: 0B - Fast
refillcaused waste:fast: 0B
Let’s calculate why current waste space is 8192 bytes, i.e., 8KB. We didn’t modify TLABRefillWasteFraction, so it’s default 64. Then initial maximum waste space = TLAB size / TLABRefillWasteFraction, i.e., 512KB / 64 = 8KB.
After the first forced FullGC, we see related logs like:
//First output each thread's current TLAB information
[0.915s][trace][gc,tlab] GC(0) TLAB: gc thread: 0x000002a66a471710 [id: 12916] desired_size: 512KB slow allocs: 0  refill waste: 8192B alloc: 1.00000     8192KB refills: 15 waste  7.1% gc: 360616B slow: 13880B fast: 0B
[0.915s][trace][gc,tlab] GC(0) TLAB: gc thread: 0x000002a60028d180 [id: 24604] desired_size: 512KB slow allocs: 0  refill waste: 8192B alloc: 1.00000     8192KB refills: 0 waste  0.0% gc: 0B slow: 0B fast: 0B
[0.915s][trace][gc,tlab] GC(0) TLAB: gc thread: 0x000002a60028e900 [id: 15380] desired_size: 512KB slow allocs: 0  refill waste: 8192B alloc: 1.00000     8192KB refills: 1 waste 99.9% gc: 524008B slow: 0B fast: 0B
//... (omitting other thread logs)

//GC TLAB statistics
[0.915s][debug][gc,tlab] GC(0) TLAB totals: thrds: 7  refills: 21 max: 15 slow allocs: 0 max 0 waste: 38.0% gc: 2974616B max: 524008B slow: 13880B max: 13880B fast: 0B max: 0B

//Each thread's TLAB expected size changes
[0.979s][trace][gc,tlab] GC(0) TLAB new size: thread: 0x000002a66a471710 [id: 12916] refills 50  alloc: 1.000000 desired_size: 65536 -> 65536
//... (omitting other thread logs)

//GC information
[0.980s][info ][gc     ] GC(0) Pause Full (WhiteBox Initiated Full GC) 7M->0M(512M) 65.162ms
First outputs each thread’s current TLAB information, similar to previous refill TLAB allocation, but with GC global sequence number starting from 0. GC(0) represents first GC related logs.
Then GC TLAB statistics: [0.915s][debug][gc,tlab] GC(0) TLAB totals: thrds: 7 refills: 21 max: 15 slow allocs: 0 max 0 waste: 38.0% gc: 2974616B max: 524008B slow: 13880B max: 13880B fast: 0B max: 0B:
- Total 7 threads used TLAB:
thrds: 7, meaning only 7 threads in previousGC(0)TLAB info logs have refills > 0 - Current GC all threads refills count
refills: 21 - Historical maximum refills count in any GC
max: 15 - Current GC all threads slow allocation count
slow allocs: 0 - Historical maximum slow allocation count in any GC
max: 0 - Current GC all threads TLAB memory waste ratio
waste: 38.0% - Various waste memory sizes:
gc: 2974616B max: 524008B slow: 13880B max: 13880B fast: 0B max: 0B
Next prints each thread’s TLAB expected size changes: [0.979s][trace][gc,tlab] GC(0) TLAB new size: thread: 0x000002a66a471710 [id: 12916] refills 50 alloc: 1.000000 desired_size: 65536 -> 65536, still in MarkWordSize not actual bytes.
Finally current GC info: [0.980s][info ][gc ] GC(0) Pause Full (WhiteBox Initiated Full GC) 7M->0M(512M) 65.162ms, representing FullGC triggered by WhiteBox, heap memory usage reclaimed from 7M to 0M, total heap memory size 512M, total pause time 65.162 ms.
Next our program requested 512 objects sized 1KB each. Why is new byte[OBJECT_SIZE - BYTE_ARRAY_OVERHEAD] size 1KB? Because array object header defaults to 16 bytes, so adding 1012 bytes makes 1KB. After loop ends, we see these two log lines:
[0.989s][trace][gc,tlab] ThreadLocalAllocBuffer::compute_size(128) returns 65536
[0.989s][trace][gc,tlab] TLAB: fill thread: 0x000002a66a471710 [id: 12916] desired_size: 512KB slow allocs: 0  refill waste: 8192B alloc: 1.00000     1024KB refills: 1 waste  0.0% gc: 0B slow: 0B fast: 0B
[0.989s][trace][gc,tlab] ThreadLocalAllocBuffer::compute_size(128) returns 65536
[0.989s][trace][gc,tlab] TLAB: fill thread: 0x000002a66a471710 [id: 12916] desired_size: 512KB slow allocs: 0  refill waste: 8192B alloc: 1.00000     1024KB refills: 2 waste  0.1% gc: 0B slow: 1024B fast: 0B
We can see two refills occurred. First was thread’s initial object creation request, second was requesting the 512th object. TLAB size is 512 KB, previous 511KB already occupied. Based on previous TLAB principle analysis, we know that dummy objects filling requires reserving array object header size, so remaining allocatable space is actually insufficient for 1KB, requiring refill. Also, wasted space (1KB) is less than current waste space limit (8KB), so can re-request new TLAB for allocation.
Then our program after FullGC continued requesting 200 large objects sized 100KB each. Here we ignore GC related logs, only looking at logs generated during object allocation.
[3036.734s][trace][gc,tlab] ThreadLocalAllocBuffer::compute_size(12800) returns 65536
[3036.734s][trace][gc,tlab] TLAB: fill thread: 0x000002a66a471710 [id: 12916] desired_size: 512KB slow allocs: 0  refill waste: 8192B alloc: 1.00000     1024KB refills: 1 waste  0.0% gc: 0B slow: 0B fast: 0B
[3047.276s][trace][gc,tlab] TLAB: slow thread: 0x000002a66a471710 [id: 12916] obj: 12800 free: 1464 waste: 1028
[3047.276s][trace][gc,tlab] TLAB: slow thread: 0x000002a66a471710 [id: 12916] obj: 12800 free: 1464 waste: 1032
[3047.276s][trace][gc,tlab] TLAB: slow thread: 0x000002a66a471710 [id: 12916] obj: 12800 free: 1464 waste: 1036
[3047.276s][trace][gc,tlab] TLAB: slow thread: 0x000002a66a471710 [id: 12916] obj: 12800 free: 1464 waste: 1040
[3047.276s][trace][gc,tlab] TLAB: slow thread: 0x000002a66a471710 [id: 12916] obj: 12800 free: 1464 waste: 1044
[3047.276s][trace][gc,tlab] TLAB: slow thread: 0x000002a66a471710 [id: 12916] obj: 12800 free: 1464 waste: 1048
//Omitting middle allocation logs...
[3047.279s][trace][gc,tlab] TLAB: slow thread: 0x000002a66a471710 [id: 12916] obj: 12800 free: 1464 waste: 1452
[3047.279s][trace][gc,tlab] TLAB: slow thread: 0x000002a66a471710 [id: 12916] obj: 12800 free: 1464 waste: 1456
[3047.279s][trace][gc,tlab] TLAB: slow thread: 0x000002a66a471710 [id: 12916] obj: 12800 free: 1464 waste: 1460
[3047.279s][trace][gc,tlab] TLAB: slow thread: 0x000002a66a471710 [id: 12916] obj: 12800 free: 1464 waste: 1464
[3047.279s][trace][gc,tlab] ThreadLocalAllocBuffer::compute_size(12800) returns 65536
[3047.279s][trace][gc,tlab] TLAB: fill thread: 0x000002a66a471710 [id: 12916] desired_size: 512KB slow allocs: 110  refill waste: 11712B alloc: 1.00000    13312KB refills: 2 waste  1.2% gc: 0B slow: 12288B fast: 0B
[3047.279s][trace][gc,tlab] TLAB: slow thread: 0x000002a66a471710 [id: 12916] obj: 12800 free: 1464 waste: 1028
[3047.279s][trace][gc,tlab] TLAB: slow thread: 0x000002a66a471710 [id: 12916] obj: 12800 free: 1464 waste: 1032
[3047.279s][trace][gc,tlab] TLAB: slow thread: 0x000002a66a471710 [id: 12916] obj: 12800 free: 1464 waste: 1036
[3047.279s][trace][gc,tlab] TLAB: slow thread: 0x000002a66a471710 [id: 12916] obj: 12800 free: 1464 waste: 1040
//Omitting middle allocation logs...
[3047.281s][trace][gc,tlab] TLAB: slow thread: 0x000002a66a471710 [id: 12916] obj: 12800 free: 1464 waste: 1340
100KB objects convert to MarkWordSize as 12800, corresponding to log: [3036.734s][trace][gc,tlab] ThreadLocalAllocBuffer::compute_size(12800) returns 65536. Current calculated TLAB size is still 65536 MarkWordSize, i.e., 512KB. Starting from allocating the fifth object, TLAB remaining memory is insufficient. But initial maximum waste space is 8KB, so can only allocate directly in Eden region and increase maximum waste space according to TLABWasteIncrement (default 4) setting, i.e., increment by 4 * MarkWordSize = 32 bytes each time. Reflected in logs:
[3047.276s][trace][gc,tlab] TLAB: slow thread: 0x000002a66a471710 [id: 12916] obj: 12800 free: 1464 waste: 1028
[3047.276s][trace][gc,tlab] TLAB: slow thread: 0x000002a66a471710 [id: 12916] obj: 12800 free: 1464 waste: 1032
[3047.276s][trace][gc,tlab] TLAB: slow thread: 0x000002a66a471710 [id: 12916] obj: 12800 free: 1464 waste: 1036
[3047.276s][trace][gc,tlab] TLAB: slow thread: 0x000002a66a471710 [id: 12916] obj: 12800 free: 1464 waste: 1040
We can see each non-TLAB allocation increases maximum waste space limit by 4. When remaining space becomes less than maximum waste space limit, thread refills requesting a new TLAB for allocation:
[3047.279s][trace][gc,tlab] TLAB: slow thread: 0x000002a66a471710 [id: 12916] obj: 12800 free: 1464 waste: 1456
[3047.279s][trace][gc,tlab] TLAB: slow thread: 0x000002a66a471710 [id: 12916] obj: 12800 free: 1464 waste: 1460
[3047.279s][trace][gc,tlab] TLAB: slow thread: 0x000002a66a471710 [id: 12916] obj: 12800 free: 1464 waste: 1464
[3047.279s][trace][gc,tlab] ThreadLocalAllocBuffer::compute_size(12800) returns 65536
[3047.279s][trace][gc,tlab] TLAB: fill thread: 0x000002a66a471710 [id: 12916] desired_size: 512KB slow allocs: 110  refill waste: 11712B alloc: 1.00000    13312KB refills: 2 waste  1.2% gc: 0B slow: 12288B fast: 0B
With this, we’ve analyzed basically all TLAB-related logs.