Problem Background#
However, after the upgrade to Spring Boot 2.4.6 + Spring Cloud 2020.0.x, we noticed a significant increase in YoungGC frequency and object allocation rate, while object promotion to the old generation remained unchanged. This indicated that newly created objects were being quickly garbage collected. Let’s examine the monitoring data for one of our processes, which was handling approximately 100 HTTP requests per second:

This was puzzling. The request rate wasn’t particularly high, yet monitoring showed nearly 2GB of memory being allocated per second. Before the upgrade, this allocation rate was around 100-200MB under similar request loads. Where was all this extra memory consumption coming from?
Problem Investigation#
We needed to examine statistical data for various objects in memory using the jmap command. However, we couldn’t just look at statistics for live objects only, since monitoring indicated the issue wasn’t excessive old generation objects—promotion rates hadn’t increased. Ideally, we wanted to exclude currently live objects from our analysis. Additionally, with GC occurring quite frequently (approximately every second), we couldn’t expect to capture the desired jmap data in a single attempt. Since jmap causes all threads to enter safepoint and triggers STW (Stop-The-World), impacting production, we couldn’t run it too frequently. Therefore, we adopted the following strategy:
- Scale up by adding one instance, then use the service registry and rate limiter to redirect half the traffic away from one specific instance;
- On this instance, consecutively execute
jmap -histo(statistics for all objects) andjmap -histo:live(statistics for live objects only); - Repeat step 2 five times with intervals of 100ms, 300ms, 500ms, and 700ms;
- Remove the rate limiting on this instance and shut down the newly scaled instance.
Through comparing these jmap results, we discovered that among the top-ranking object types in the jmap statistics, there was a Spring framework object:
 num     #instances         #bytes  class name (module)
-------------------------------------------------------
   1:       7993252      601860528  [B ([email protected])
   2:        360025      296261160  [C ([email protected])
   3:      10338806      246557984  [Ljava.lang.Object; ([email protected])
   4:       6314471      151547304  java.lang.String ([email protected])
   5:         48170      135607088  [J ([email protected])
   6:        314420      126487344  [I ([email protected])
   7:       4591109      110100264  [Ljava.lang.Class; ([email protected])
   8:        245542       55001408  org.springframework.core.ResolvableType
   9:        205234       29042280  [Ljava.util.HashMap$Node; ([email protected])
  10:        386252       24720128  [org.springframework.core.ResolvableType;
  11:        699929       22397728  java.sql.Timestamp ([email protected])
  12:         89150       21281256  [Ljava.beans.PropertyDescriptor; ([email protected])
  13:        519029       16608928  java.util.HashMap$Node ([email protected])
  14:        598728       14369472  java.util.ArrayList ([email protected])
How were these objects being created? How do you trace frequently created objects that are no longer alive, especially when the object type is internal to the framework?
First, MAT (Eclipse Memory Analyzer) + jmap dump for complete heap analysis wasn’t quite suitable for the following reasons:
- The objects were no longer alive. MAT is better suited for memory leak analysis, whereas our issue involved creating many unexpected objects that consumed significant memory but quickly became unreachable.
- For objects that are no longer alive, MAT cannot accurately analyze their creators, mainly because it’s uncertain whether the dump captures the information we need, or there might be too much noise in the data.
Although this approach wasn’t suitable for our problem, I’ll still show the MAT analysis results from the jmap dump I collected:
So how should we proceed with the analysis? This brings us back to our old friend: JFR + JMC. Regular readers know I frequently use JFR for troubleshooting production issues. How do we use it here? While there’s no direct JFR event that statistics which objects are frequently created, there are indirect events that can reveal who’s creating so many objects. I typically approach this as follows:
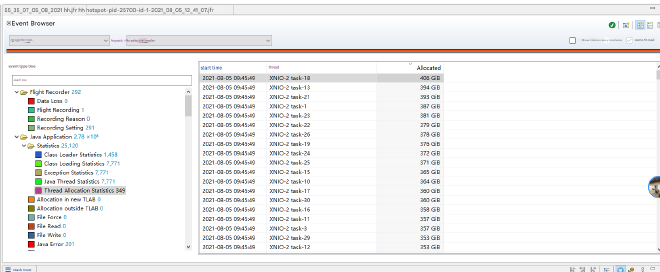
- Use Thread Allocation Statistics events to identify which threads are allocating excessive objects.
- Use Method Profiling Samples to analyze which hot code paths might be generating these objects. For objects created in large quantities, capturing Runnable code has a high probability of being sampled and will show high proportions in the events.
First, examining the Thread Allocation Statistics events, we found that essentially all servlet threads (the threads handling HTTP requests—we use Undertow, so thread names start with XNIO) were allocating many objects. This didn’t help pinpoint the issue:
Next, we examined the hot code statistics by clicking on Method Profiling Sample events and viewing stack trace statistics to see which had high proportions.
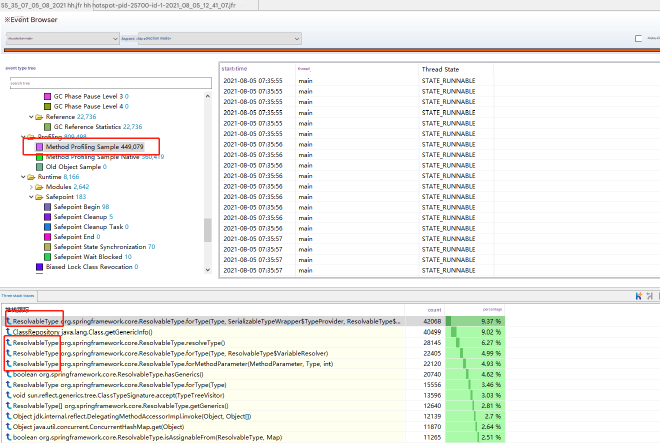
We discovered that the top-ranking methods all seemed related to ResolvableType. For further investigation, we double-clicked the first method to view call stack statistics:
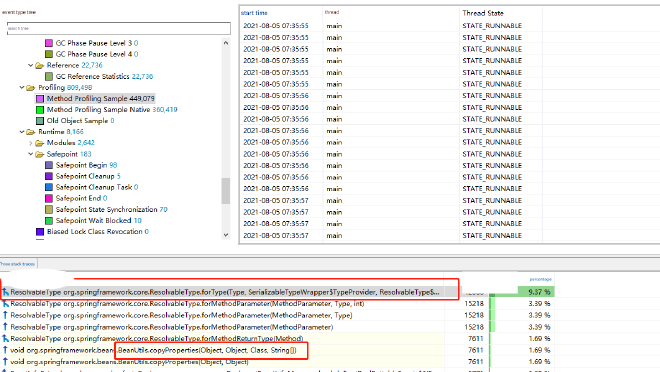
We found that the caller was BeanUtils.copyProperties. Examining other ResolvableType-related calls, they were all associated with BeanUtils.copyProperties. This method is frequently used in our project for property copying between objects of the same or different types. Why was this method creating so many ResolvableType objects?
Problem Analysis#
By examining the source code, we discovered that starting from Spring 5.3.x, BeanUtils began using ResolvableType as a unified class information wrapper for property copying:
/**
 *
 * <p>As of Spring Framework 5.3, this method honors generic type information
 */
private static void copyProperties(Object source, Object target, @Nullable Class<?> editable,
		@Nullable String... ignoreProperties) throws BeansException {
}
The internal source code creates new ResolvableType instances for each property method of both source and target object types during each copy operation, and no caching is implemented. This results in a single copy operation creating numerous ResolvableType instances. Let’s conduct an experiment:
public class Test {
    public static void main(String[] args)  {
        TestBean testBean1 = new TestBean("1", "2", "3", "4", "5", "6", "7", "8", "1", "2", "3", "4", "5", "6", "7", "8");
        TestBean testBean2 = new TestBean();
        for (int i = 0; i > -1; i++) {
            BeanUtils.copyProperties(testBean1, testBean2);
            System.out.println(i);
        }
    }
}
We executed this code using two different dependencies: spring-beans 5.2.16.RELEASE and spring-beans 5.3.9, with JVM parameters -XX:+UnlockExperimentalVMOptions -XX:+UseEpsilonGC -Xmx512m. These parameters use EpsilonGC, which throws an OutOfMemory exception and terminates the program when heap memory is full without performing GC, with a maximum heap size of 512MB. This setup essentially tests how many times different versions of BeanUtils.copyProperties can execute before memory exhaustion.
The experimental results showed: spring-beans 5.2.16.RELEASE executed 444,489 times, while spring-beans 5.3.9 executed only 27,456 times. This represents a significant difference.
Consequently, I submitted an Issue to the spring-framework GitHub repository.
For areas in our project that frequently use BeanUtils.copyProperties, we replaced them with BeanCopier and created a simple wrapper class:
public class BeanUtils {
    private static final Cache<String, BeanCopier> CACHE = Caffeine.newBuilder().build();

    public static void copyProperties(Object source, Object target) {
        Class<?> sourceClass = source.getClass();
        Class<?> targetClass = target.getClass();
        BeanCopier beanCopier = CACHE.get(sourceClass.getName() + " to " + targetClass.getName(), k -> {
            return BeanCopier.create(sourceClass, targetClass, false);
        });
        beanCopier.copy(source, target, null);
    }
}
However, it’s important to note that the most direct issue when replacing BeanUtils.copyProperties with BeanCopier is that properties with different types but same names cannot be copied. For example, copying between int and Integer won’t work. There are also differences in deep copying behavior, requiring thorough unit testing.
After implementing these changes, the problem was resolved.
Problem Follow-up#
Spring has since fixed this issue (in version v6.0.14):
- Release notes: https://github.com/spring-projects/spring-framework/releases/tag/v6.0.14
- Corresponding commit: https://github.com/spring-projects/spring-framework/commit/09aa59f9e79e19a2f09e66002c665b6a5a03ae20
The main fix approach includes:
- Reduced memory usage by avoiding ResolvableType for simple type checking
- Improved performance by using HashSet for more efficient lookup of ignored properties