The Hidden Performance Killer: Why Code Location in Logs Can Destroy Your Microservice Performance#
When we first launched our service, we configured our production logging level to INFO and included code location information in our log output. The format looked something like this:
2022-03-02 19:57:59.425 INFO [service-apiGateway,,] [35800] [main][org.springframework.cloud.gateway.route.RouteDefinitionRouteLocator:88]: Loaded RoutePredicateFactory [Query]
We were using Log4j2 as our logging framework with asynchronous logging enabled. For Log4j2’s Disruptor WaitStrategy, we chose the CPU-friendly Sleep option by setting AsyncLoggerConfig.WaitStrategy=Sleep. As our business grew, we noticed some instances experiencing extremely high CPU usage, particularly during periods of heavy logging. To get to the bottom of this, we captured JFR dumps for further investigation.
Let’s start by examining the garbage collection patterns. We’re using G1GC, so we focused on the G1 Garbage Collection events:

The analysis revealed that all GC activity consisted of Young GC with normal execution times and no unusual frequency patterns.
Next, we dove into CPU usage analysis. Looking at the Thread CPU Load events showed us the CPU consumption per thread. What we discovered was quite alarming - the reactor-http-epoll thread pool threads were consuming nearly 100% CPU collectively.
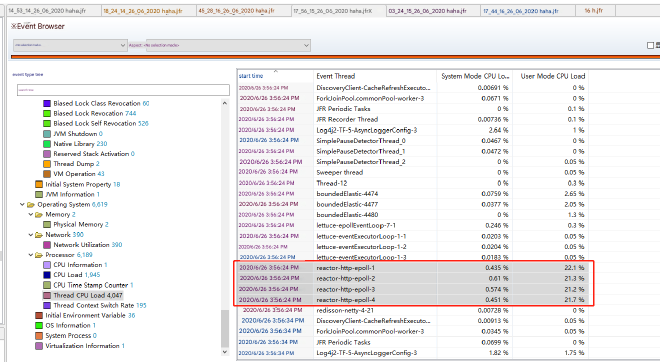
These threads handle business logic in reactor-netty. When we compared this with other healthy instances, we found that normal operations shouldn’t produce such high CPU loads. So what was causing this excessive load? Time for some thread dump analysis!
After examining multiple thread stack dumps, we found these threads were consistently in a Runnable state, executing native methods related to StackWalker. This aligned perfectly with the Method Runnable events in our JFR data, confirming that CPU was primarily consumed by these specific method calls:
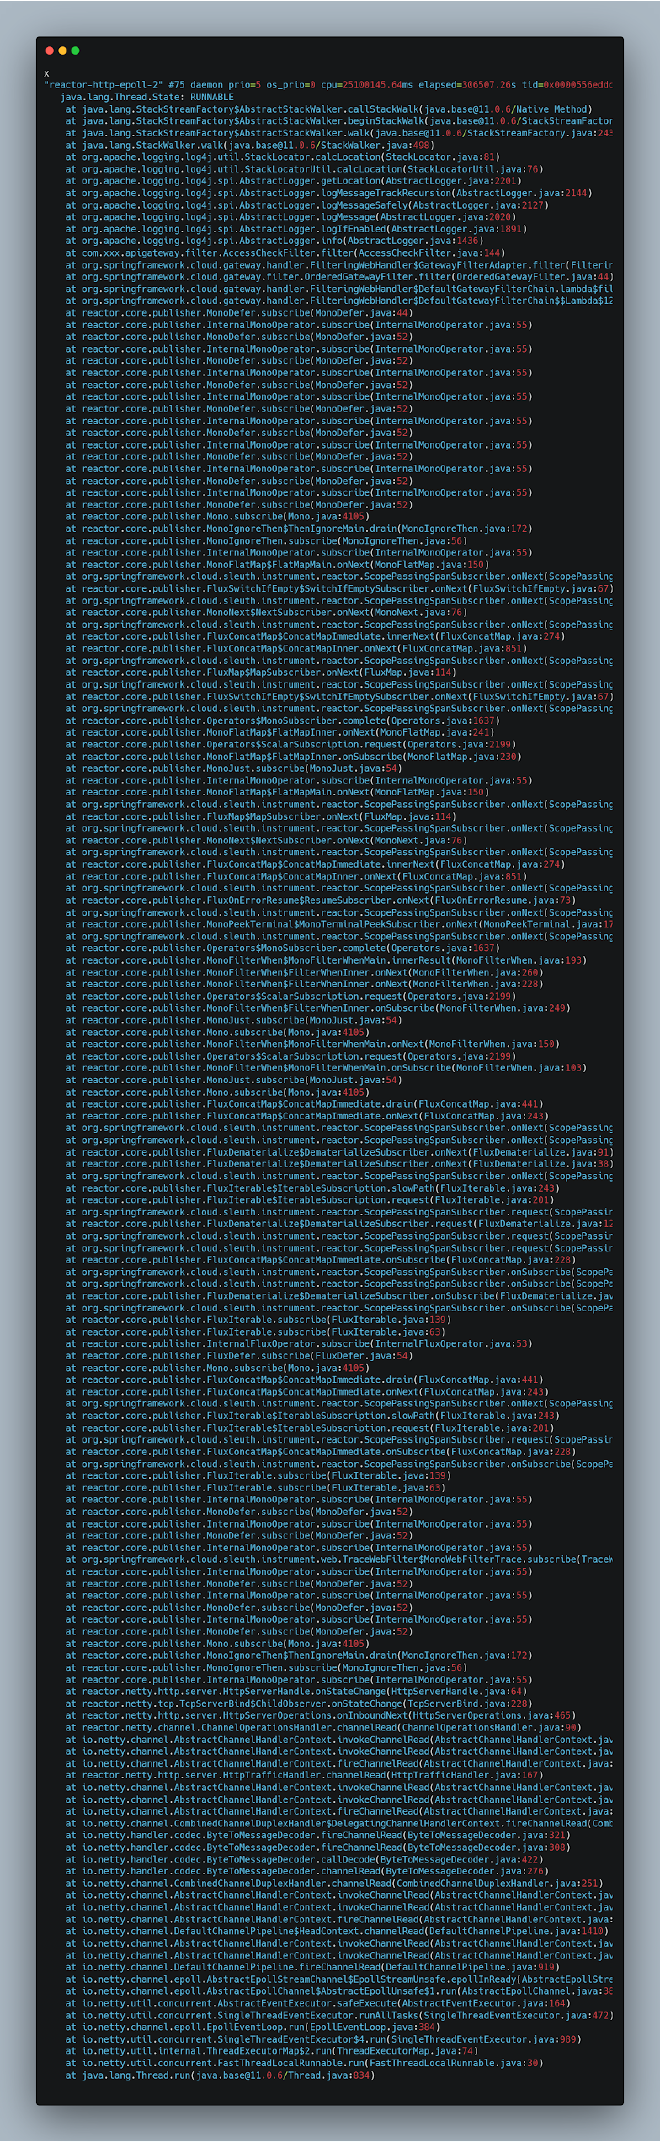
The culprits were two native methods:
java.lang.StackStreamFactory$AbstractStackWalker.callStackWalkjava.lang.StackStreamFactory$AbstractStackWalker.fetchStackFrames
Here’s something crucial to understand: microservice thread stacks can be incredibly deep (around 150 levels), and reactive code makes this even worse (potentially reaching 300 levels). This happens because servlets and filters use a chain-of-responsibility pattern, with each filter adding to the stack. Reactive code amplifies this with its layered approach and various observation points. The stack trace above is a perfect example of reactive stack depth.
These native methods are doing one specific thing: determining the code location where the logging method was called. This includes class name, method name, and line number. In our stack trace example, the actual logging call location is: at com.xxx.apigateway.filter.AccessCheckFilter.filter(AccessCheckFilter.java:144), where we used log.info() to output some logs.
Clearly, Log4j2 obtains the calling code location by walking the current thread’s stack. It’s not simply the top of the stack - it needs to find the first stack element after the log4j2 framework elements to identify the actual logging call location.
How Log4j2 Retrieves Stack Information#
Let’s think about how we’d implement this ourselves. Before Java 9, getting the current thread’s stack (we’re not dealing with other threads here) could be done through:
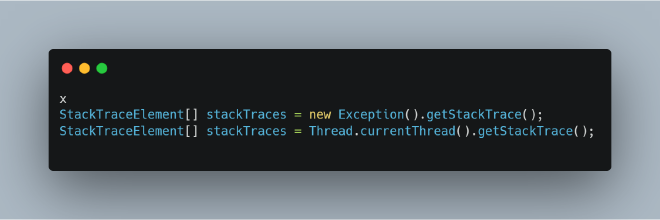
Note that Thread.currentThread().getStackTrace(); is essentially new Exception().getStackTrace(); under the hood, so they’re functionally equivalent.
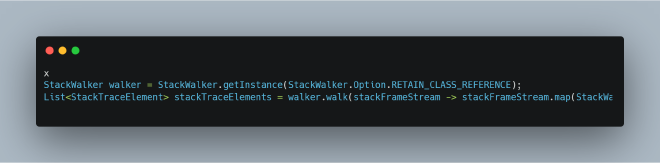
Java 9 introduced the new StackWalker interface, which provides a more elegant way to read stacks using the Stream interface:
Let’s examine how new Exception().getStackTrace(); works internally:
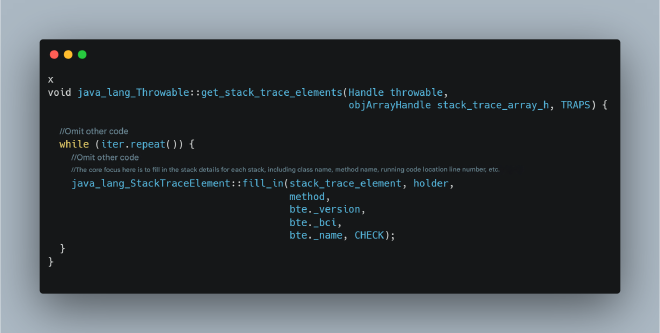
And here’s the core implementation for StackWalker:
Both approaches fundamentally populate stack details, but one fills everything while the other reduces the amount of stack information populated. Populating stack information primarily involves accessing SymbolTable and StringTable, since we need actual class and method names rather than memory addresses. Obviously: Exception-based stack retrieval accesses Symbol Table and String Table more frequently than StackWalker because it needs to populate more stack frames.
Let’s test this by simulating how retrieving code execution location impacts the performance of our original code at different stack depths.
Performance Impact Comparison: Code Location Retrieval vs. No Location#
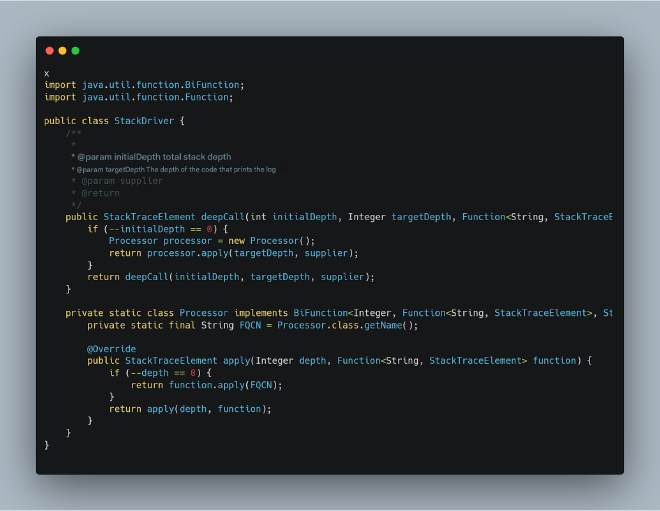
The following code is based on Log4j2’s official unit tests. First, let’s simulate stack calls at various depths:
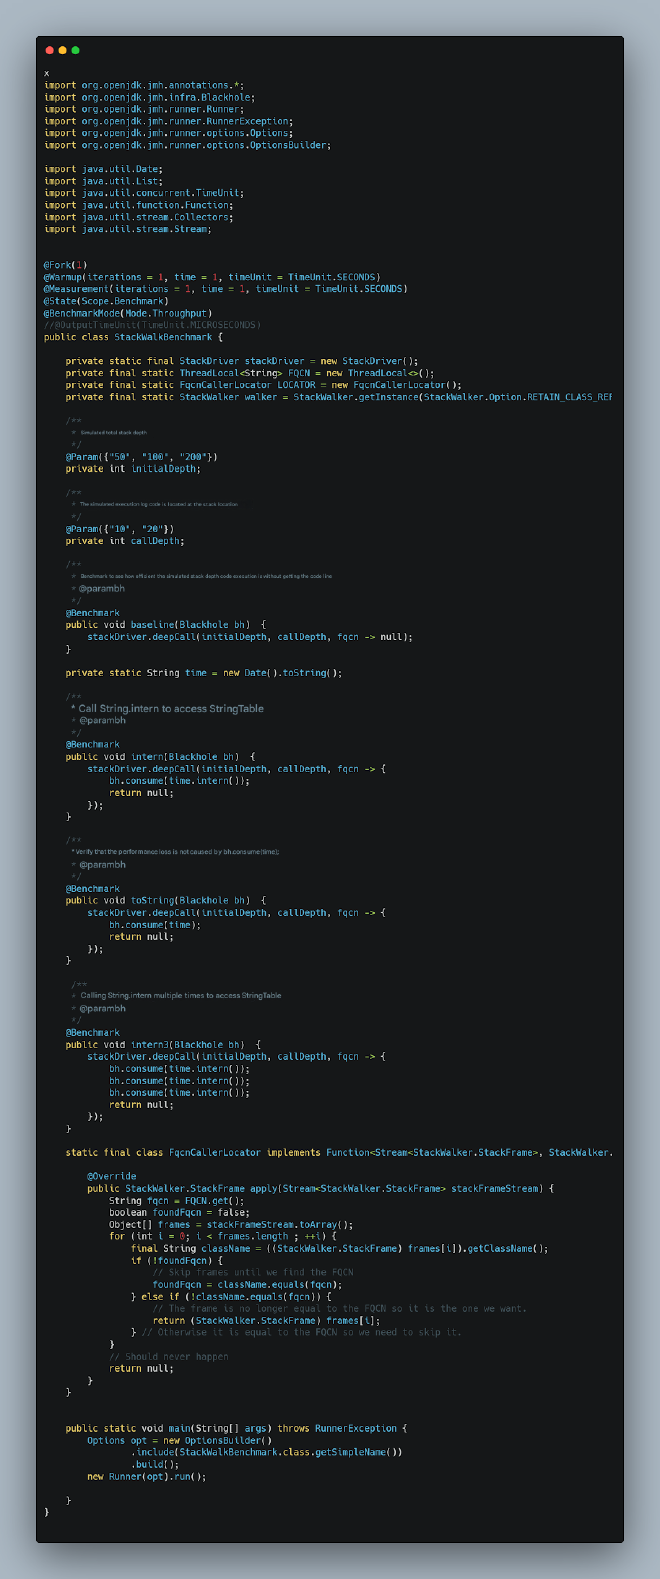
Then we’ll write test code to compare the performance difference between pure execution and execution with stack retrieval:

Running the test gives us these results:
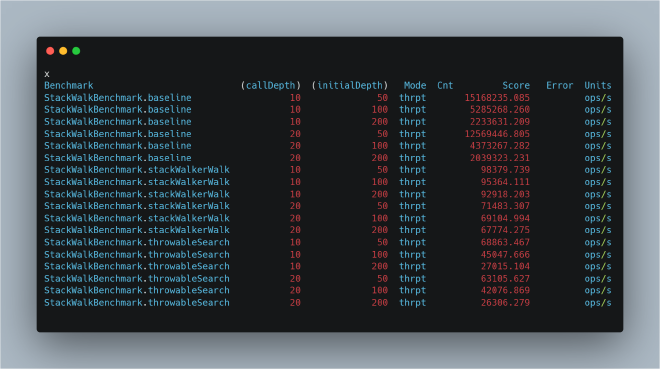
The results clearly show that retrieving code execution location (i.e., getting the stack) causes significant performance degradation. Moreover, this performance loss correlates with stack population - more populated frames mean greater loss. We can see this from StackWalker’s superior performance compared to Exception-based stack retrieval, with the performance gap widening as stack depth increases.
Why Is It Slow? Testing String::intern Performance Impact#
This performance degradation stems from StringTable and SymbolTable access, as we saw in the JVM source code analysis. We can simulate this access since the underlying StringTable operations use String’s intern method. Here’s our simulation test using String::intern:
Test results: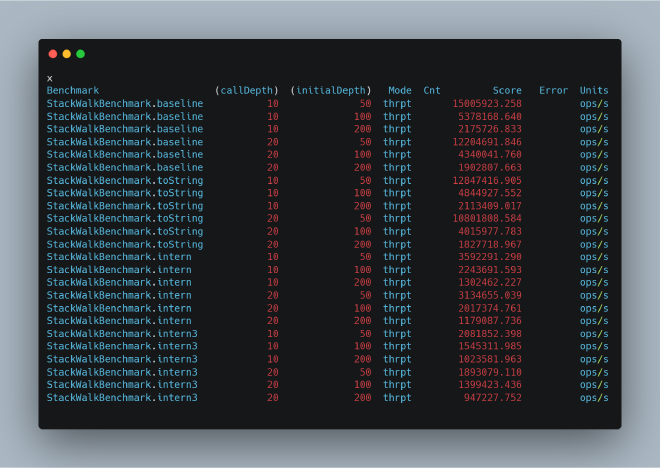
Comparing StackWalkBenchmark.baseline with StackWalkBenchmark.toString shows that bh.consume(time); itself has negligible performance impact. However, comparing these with StackWalkBenchmark.intern and StackWalkBenchmark.intern3 reveals severe performance degradation that worsens with increased access frequency (analogous to stack retrieval).
Conclusions and Recommendations#
From this analysis, we can draw some clear conclusions:
- Code location output in logs uses Exception-based stack retrieval before Java 9, and StackWalker afterward
- Both approaches require SymbolTable and StringTable access, with StackWalker reducing access by limiting populated stack frames
- Both approaches cause severe performance degradation.
Therefore, I strongly recommend: For microservice environments, especially reactive microservice environments with very deep stacks, avoid including code location in high-volume logs as it causes severe performance degradation.
After disabling code location output in our logs, we observed significantly lower CPU usage under the same load conditions, along with noticeable improvements in overall throughput.