Tackling a Mysterious JVM Safepoint Issue: A Journey from Problem to Solution#
Recently, we encountered a peculiar issue in our production environment: certain high-volume logging applications would freeze for extended periods whenever the hourly log synchronization task kicked off at 5 minutes past each hour. Through careful examination of our safepoint logs (enabled via the startup parameter -Xlog:safepoint=trace:file=${LOG_PATH}/safepoint%t.log:utctime,level,tags:filecount=10,filesize=10M and utilizing Java 17’s -Xlog:async for asynchronous logging to prevent JVM log output from blocking the process), we discovered that all incidents were caused by:
- GC logs: -Xlog:gc*=debug:file=${LOG_PATH}/gc%t.log:utctime,level,tags:filecount=50,filesize=100M
- JIT compilation logs: -Xlog:jit+compilation=info:file=${LOG_PATH}/jit_compile%t.log:utctime,level,tags:filecount=10,filesize=10M
- Disabled stack trace omission: This only omits internal JDK exceptions like NullPointerException: -XX:-OmitStackTraceInFastThrow, which we had already optimized to handle performance pressure from excessive stack trace output during high error volumes
After implementing these configurations, our application exhibited a strange problem with three distinct manifestations, all sharing one common characteristic: exceptionally long safepoint durations.
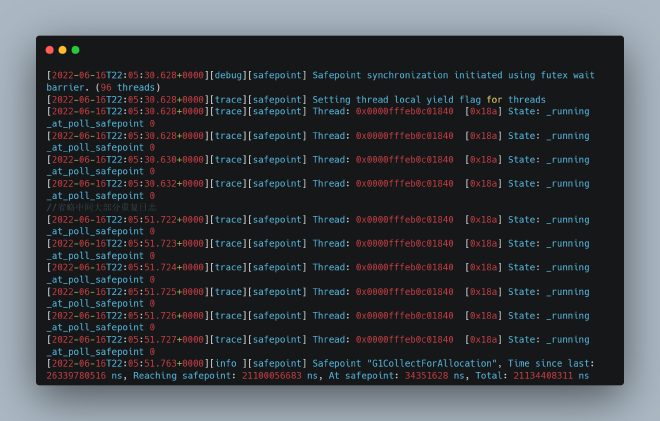
1. Safepoint logs revealed extremely long wait times for all threads to reach the safepoint (Reaching safepoint: over 25 seconds)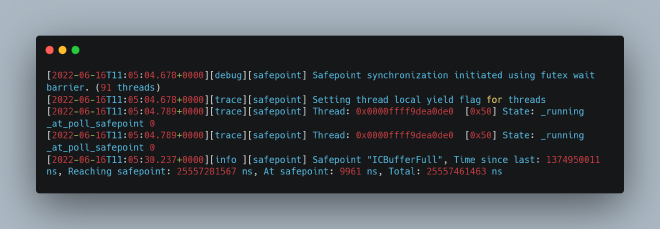
2. Safepoint logs showed extended safepoint durations caused by GC (At safepoint: over 37 seconds)
Examining the GC logs, we noticed a significant delay between Heap before GC invocations and the heap structure output logs: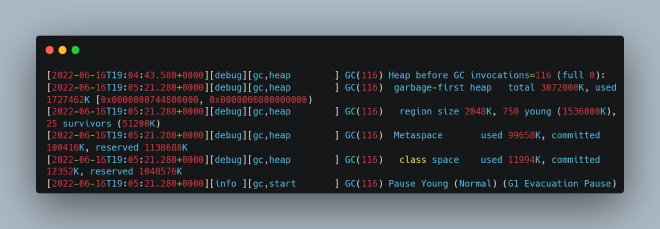
3. Another case of prolonged safepoint duration due to GC, but with different log interval patterns (over 29 seconds)
The GC logs showed certain heap structure output logs with substantial delays:
Problem Investigation#
When Java application threads are collectively in a safepoint, they become completely inactive. This means that application thread-dependent monitoring—such as external JVM monitoring through Spring Actuator’s Prometheus endpoints and Skywalking instrumentation—becomes blind to the actual issue. These monitoring tools only show that methods called during safepoints take exceptionally long, but this doesn’t indicate that these methods themselves are the bottleneck.
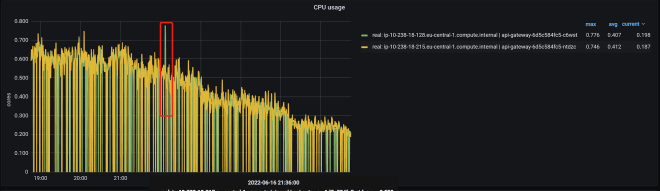
We needed to rely on internal JVM monitoring mechanisms, such as JVM logs and JFR (Java Flight Recording) for proper diagnosis. We also utilized async_profiler (https://github.com/jvm-profiling-tools/async-profiler/) because we observed that during problematic periods, the process’s own CPU usage (not the machine’s, but specifically this process) would spike dramatically:
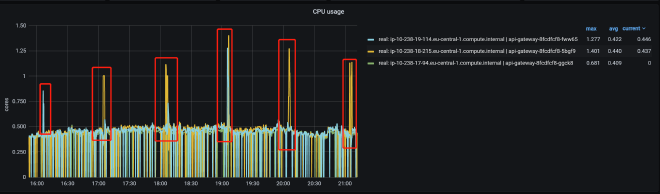
Curiously, when examining CPU usage through async_profiler during the problematic timeframes, we found that aside from the expected patterns:
Most remarkably, during safepoint periods, logging appeared to be interrupted—an extremely rare occurrence. Here’s why this observation is significant:
For the first phenomenon (extended wait times for all threads to enter safepoint), we would typically expect continuous output of logs indicating which threads haven’t entered the safepoint, as referenced in the JVM source code:
https://github.com/openjdk/jdk/blob/master/src/hotspot/share/runtime/safepoint.cpp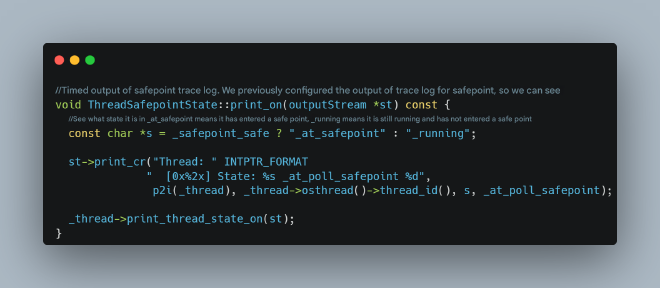
However, in our first phenomenon, we didn’t observe any logs indicating which specific thread was causing the extended safepoint entry time.
For the second phenomenon, JFR analysis didn’t reveal any particularly time-consuming GC phases: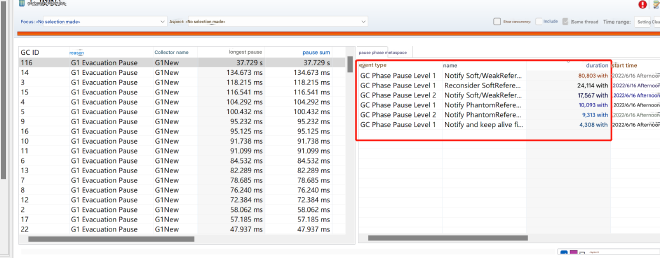
For the third phenomenon, examining the JVM source code revealed that between the two logs with large intervals, virtually nothing happens except logging. Additionally, all problematic timestamps occurred around 05 minutes past each hour. Upon consulting our operations team, we learned that this timing coincides with the previous hour’s log file removal and EFS synchronization (we generate one log file per hour), involving substantial file I/O operations (since we’re using cloud services, this might involve EFS-type NFS or network object storage rather than traditional disk I/O). Could excessive file I/O be blocking JVM log output and consequently freezing the entire JVM?
Why would JVM log output block all application threads? If a JVM thread gets stuck outputting logs outside of a safepoint, it would only block itself, not all application threads. However, if this occurs during a safepoint when all application threads are already suspended, a stuck JVM thread outputting logs could prevent all threads from entering the safepoint or cause extended safepoint durations. For the first phenomenon, a thread outputting JVM logs (not application logs—application log output typically involves native file I/O calls, which are considered to be in safepoint state and wouldn’t cause issues, as detailed in my other article: JVM Related - SafePoint and Stop The World Complete Guide: https://zhuanlan.zhihu.com/p/161710652) gets stuck, preventing that thread from entering the safepoint. For phenomena two and three, GC threads get stuck outputting JVM logs, preventing GC completion.
Let’s first examine the JVM source code to confirm whether stuck JVM log output can indeed block the JVM.
JVM Log Output Source Code Analysis#
We’re using Java 17, which introduced asynchronous JVM log output (unavailable in earlier versions). For our source code analysis, let’s ignore the asynchronous logging code to understand pre-Java 17 log output behavior:
https://github.com/openjdk/jdk/blob/master/src/hotspot/share/logging/logFileStreamOutput.cpp
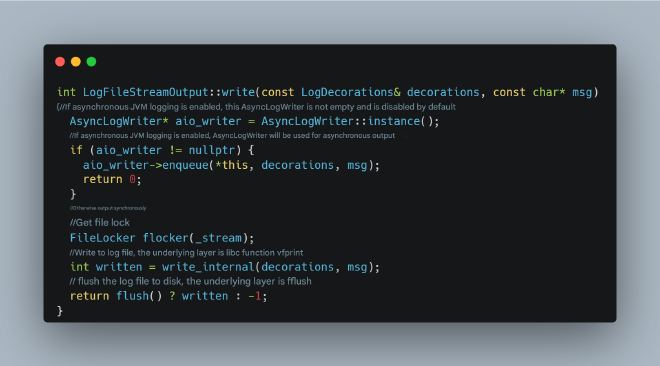
This code clearly shows that if file I/O output gets stuck, the flush operation will block. Additionally, there would be brief CPU spikes because the flushing wait strategy likely involves CPU spinning for a period before entering a blocked state.
What about switching to asynchronous logging? What parameters are available? JVM asynchronous logging was introduced in Java 17, corresponding to issue: https://bugs.openjdk.org/browse/JDK-8229517, with these key parameters: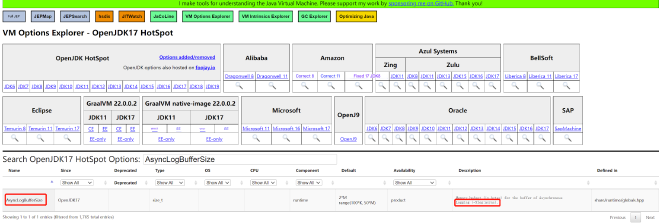
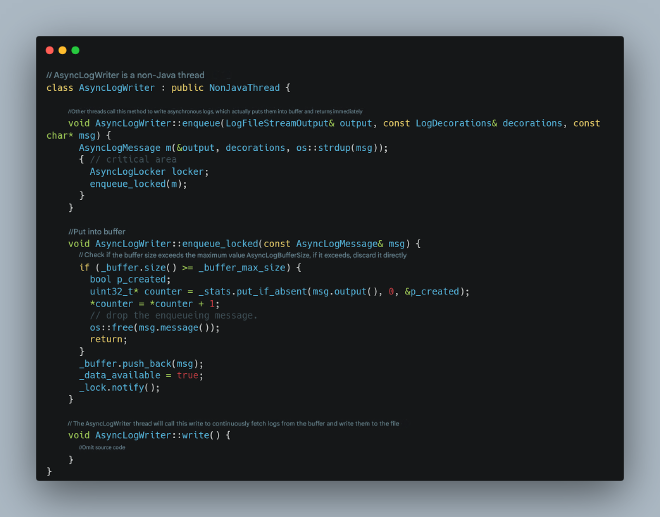
Enable JVM asynchronous logging with -Xlog:async and specify the asynchronous log buffer size with -XX:AsyncLogBufferSize= (default is 2097152, or 2MB). The asynchronous logging principle works as follows:
Implementing Asynchronous Logging: Significant Improvement with Remaining Issues#
We modified our configuration to use asynchronous logging by adding startup parameters: -Xlog:async and -XX:AsyncLogBufferSize=4194304. After observation, the problem was significantly alleviated:
However, one instance still experienced the issue, but with different symptoms. The safepoint logs now showed a thread continuously running and refusing to enter the safepoint:
What was this thread doing? We used jstack to identify the thread:
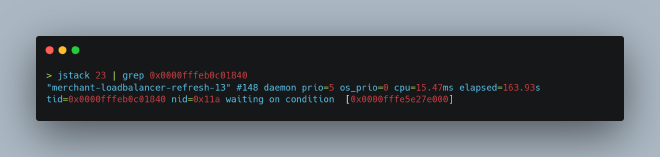
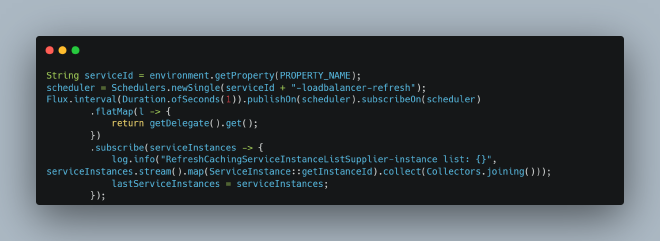
This was a scheduled thread for refreshing the microservice instance list, and the code wasn’t using WebFlux properly:
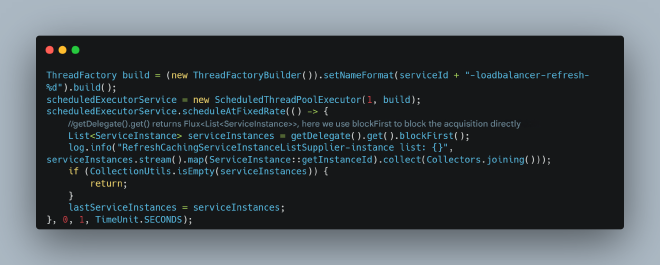
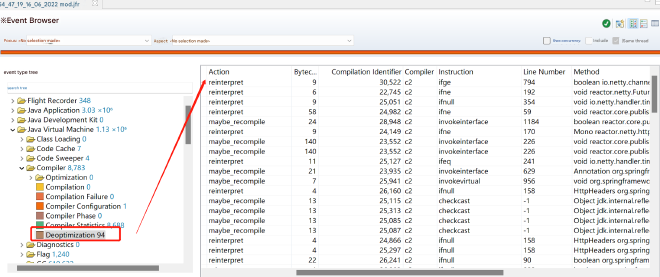
This improper use of asynchronous code can lead to JIT optimization errors (correct usage is called frequently, and this incorrect usage is also called frequently, causing continuous JIT C2 optimization and deoptimization). JFR analysis revealed numerous JIT deoptimizations during this period:
This can cause missing safepoints, leading to I/O operations continuously spinning and waiting for extended periods. We needed to correct the usage:
After implementing the proper approach, the issue of threads refusing to enter safepoints disappeared completely.