This article provides a detailed analysis of JVM memory structure. While there are many online resources about JVM memory structure with accompanying diagrams, much of the information contains errors due to being second-hand or simply repeating others’ work, leading to widespread misconceptions. Additionally, confusion often arises from mixing JVM Specification definitions with actual Hotspot JVM implementations - sometimes people discuss JVM Specification while other times they refer to Hotspot implementation details, creating a fragmented understanding.
This article primarily focuses on Hotspot implementation in Linux x86 environments, closely examining JVM source code and using various JVM tools for verification to help readers understand JVM memory structure. However, this article is limited to analyzing the purpose, usage limitations, and related parameters of these memory areas. Some sections may be quite in-depth, while others may require integration with JVM modules that use these memory areas, which will be described in detail in another series of articles.
1. Starting with Native Memory Tracking#
What exactly does JVM memory include? There are various opinions online. Let’s introduce this topic through an official tool for viewing JVM memory usage: Native Memory Tracking. It’s important to note that this tool can only monitor the size of memory natively allocated by the JVM. If memory is allocated through JDK-wrapped system APIs, it won’t be tracked - for example, DirectBuffer and MappedByteBuffer in Java JDK (though we have other ways to view their current usage). Similarly, if you wrap JNI calls to system calls for memory allocation, these are all beyond Native Memory Tracking’s scope.
1.1. Enabling Native Memory Tracking#
Native Memory Tracking works by implementing instrumentation when JVM requests memory from the system. Note that this instrumentation is not without cost, as we’ll see later. Due to the need for instrumentation and the many places where memory is allocated in the JVM, this instrumentation has significant overhead. Native Memory Tracking is disabled by default and cannot be enabled dynamically (since it relies on instrumentation for statistics collection - if it could be enabled dynamically, memory allocations before enabling wouldn’t be recorded, making dynamic enabling impossible). Currently, it can only be enabled through startup parameters when launching the JVM, using -XX:NativeMemoryTracking:
-XX:NativeMemoryTracking=off: This is the default value, disabling Native Memory Tracking-XX:NativeMemoryTracking=summary: Enables Native Memory Tracking, but only statistics memory usage by JVM subsystems-XX:NativeMemoryTracking=detail: Enables Native Memory Tracking, statistics memory usage from the perspective of different call paths for each JVM memory allocation. Note that enabling detail mode consumes significantly more resources than summary mode because detail mode must parse CallSites to identify call locations. We generally don’t need such detailed information unless we’re JVM developers.
After enabling, we can view Native Memory Tracking information using the jcmd command: jcmd <pid> VM.native_memory:
jcmd <pid> VM.native_memoryorjcmd <pid> VM.native_memory summary: These are equivalent, viewing Native Memory Tracking summary information. The default unit is KB, but you can specify other units, e.g.,jcmd <pid> VM.native_memory summary scale=MBjcmd <pid> VM.native_memory detail: Views Native Memory Tracking detail information, including summary information, memory usage grouped by virtual memory mappings, and memory usage grouped by different CallSite calls. Default unit is KB, but you can specify others, e.g.,jcmd <pid> VM.native_memory detail scale=MB
1.2. Using Native Memory Tracking#
For Java developers and JVM users, we only need to focus on and view Native Memory Tracking summary information. Detail information is generally for JVM developers, and we don’t need to be too concerned about it. Our subsequent analysis will only involve the summary portion of Native Memory Tracking.
Generally, we only consider enabling Native Memory Tracking when encountering problems. After identifying the issue, if we want to disable it, we can use jcmd <pid> VM.native_memory shutdown to close and clean up the instrumentation and memory used by Native Memory tracking. As mentioned earlier, we cannot dynamically enable Native Memory tracking, so once dynamically disabled, this process cannot enable it again.
jcmd provides simple comparison functionality, for example:
- Use
jcmd <pid> VM.native_memory baselineto record current memory usage information - After some time,
jcmd <pid> VM.native_memory summary.diffwill output current Native Memory Tracking summary information, and if there are differences from the baseline in step 1, the differences will be displayed in the corresponding locations
However, this tool is quite crude, and sometimes we don’t know when to call jcmd <pid> VM.native_memory summary.diff appropriately because we’re unsure when memory usage issues we want to observe will occur. So we generally implement it as continuous monitoring.
1.3. Meaning of Each Part in Native Memory Tracking Summary Information#
Here’s an example Native Memory Tracking output:
Total: reserved=10575644KB, committed=443024KB
-                 Java Heap (reserved=8323072KB, committed=192512KB)
                            (mmap: reserved=8323072KB, committed=192512KB)

-                     Class (reserved=1050202KB, committed=10522KB)
                            (classes #15409)
                            (  instance classes #14405, array classes #1004)
                            (malloc=1626KB #33495)
                            (mmap: reserved=1048576KB, committed=8896KB)
                            (  Metadata:   )
                            (    reserved=57344KB, committed=57216KB)
                            (    used=56968KB)
                            (    waste=248KB =0.43%)
                            (  Class space:)
                            (    reserved=1048576KB, committed=8896KB)
                            (    used=8651KB)
                            (    waste=245KB =2.75%)

-                    Thread (reserved=669351KB, committed=41775KB)
                            (thread #653)
                            (stack: reserved=667648KB, committed=40072KB)
                            (malloc=939KB #3932)
                            (arena=764KB #1304)

-                      Code (reserved=50742KB, committed=17786KB)
                            (malloc=1206KB #9495)
                            (mmap: reserved=49536KB, committed=16580KB)

-                        GC (reserved=370980KB, committed=69260KB)
                            (malloc=28516KB #8340)
                            (mmap: reserved=342464KB, committed=40744KB)

-                  Compiler (reserved=159KB, committed=159KB)
                            (malloc=29KB #813)
                            (arena=131KB #3)

-                  Internal (reserved=1373KB, committed=1373KB)
                            (malloc=1309KB #6135)
                            (mmap: reserved=64KB, committed=64KB)

-                     Other (reserved=12348KB, committed=12348KB)
                            (malloc=12348KB #14)

-                    Symbol (reserved=18629KB, committed=18629KB)
                            (malloc=16479KB #445877)
                            (arena=2150KB #1)

-    Native Memory Tracking (reserved=8426KB, committed=8426KB)
                            (malloc=325KB #4777)
                            (tracking overhead=8102KB)

-        Shared class space (reserved=12032KB, committed=12032KB)
                            (mmap: reserved=12032KB, committed=12032KB)

-               Arena Chunk (reserved=187KB, committed=187KB)
                            (malloc=187KB)

-                   Tracing (reserved=32KB, committed=32KB)
                            (arena=32KB #1)

-                   Logging (reserved=5KB, committed=5KB)
                            (malloc=5KB #216)

-                 Arguments (reserved=31KB, committed=31KB)
                            (malloc=31KB #90)

-                    Module (reserved=403KB, committed=403KB)
                            (malloc=403KB #2919)

-                 Safepoint (reserved=8KB, committed=8KB)
                            (mmap: reserved=8KB, committed=8KB)

-           Synchronization (reserved=56KB, committed=56KB)
                            (malloc=56KB #789)

-            Serviceability (reserved=1KB, committed=1KB)
                            (malloc=1KB #18)

-                 Metaspace (reserved=57606KB, committed=57478KB)
                            (malloc=262KB #180)
                            (mmap: reserved=57344KB, committed=57216KB)

-      String Deduplication (reserved=1KB, committed=1KB)
                            (malloc=1KB #8)
Let’s analyze the meaning of the above information by different subsystems:
1. Java Heap Memory - the source of memory for all Java object allocations, managed and collected by JVM GC. This will be our focus in Chapter 3:
    // Heap memory usage: reserved 8323072KB, currently committed 192512KB for actual use
    Java Heap (reserved=8323072KB, committed=192512KB)
        // All heap memory is allocated through mmap system calls
        (mmap: reserved=8323072KB, committed=192512KB)
2. Metaspace - space occupied when JVM loads class files into memory for subsequent use. Note this is JVM C++ level memory usage, mainly including class files parsed by JVM into C++ Klass classes and related elements. The corresponding Java reflection Class objects are still in heap memory space:
      // Class is total class metaspace usage: reserved 1050202KB, currently committed 10522KB for actual use
      // Total reserved 1050202KB = mmap reserved 1048576KB + malloc 1626KB
      // Total committed 10522KB = mmap committed 8896KB + malloc 1626KB
      Class (reserved=1050202KB, committed=10522KB)
            (classes #15409) // Total of 15409 classes loaded
            (  instance classes #14405, array classes #1004) // 14405 instance classes, 1004 array classes
            (malloc=1626KB #33495) // Total 1626KB allocated through malloc system calls, 33495 malloc calls
            (mmap: reserved=1048576KB, committed=8896KB) // Through mmap system calls: reserved 1048576KB, committed 8896KB for actual use
            (  Metadata:   ) // Note: MetaData doesn't belong to class metaspace, belongs to data metaspace, detailed analysis in Chapter 4
            (    reserved=57344KB, committed=57216KB) // Data metaspace currently reserved 57344KB, committed 57216KB for actual use
            (    used=56968KB) // But actual usage from MetaChunk perspective is only 56968KB for actual data allocation, 248KB waste
            (    waste=248KB =0.43%)
            (  Class space:)
            (    reserved=1048576KB, committed=8896KB) // Class metaspace currently reserved 1048576KB, committed 8896KB for actual use
            (    used=8651KB) // But actual usage from MetaChunk perspective is only 8651KB for actual data allocation, 245KB waste
            (    waste=245KB =2.75%)
      Shared class space (reserved=12032KB, committed=12032KB) // Shared class space: currently reserved 12032KB, committed 12032KB for actual use, this is actually part of Class above
            (mmap: reserved=12032KB, committed=12032KB)
      Module (reserved=403KB, committed=403KB) // Space for loading and recording modules: currently reserved 403KB, committed 403KB for actual use
            (malloc=403KB #2919)
      Metaspace (reserved=57606KB, committed=57478KB) // Equivalent to MetaChunk in Class above (excluding malloc parts): currently reserved 57606KB, committed 57478KB for actual use
            (malloc=262KB #180)
            (mmap: reserved=57344KB, committed=57216KB)
3. C++ String/Symbol Space - when loading classes, there are many string information (note: not Java strings, but JVM level C++ strings). String information from different classes may be duplicated. So they’re unified in the symbol table for reuse. Metaspace stores references to symbols in the symbol table. This isn’t the focus of this article, so we won’t analyze it in detail.
Symbol (reserved=18629KB, committed=18629KB)
(malloc=16479KB #445877) // Total 16479KB allocated through malloc system calls, 445877 malloc calls
(arena=2150KB #1) // Total 2150KB allocated through arena system calls, 1 arena call
4. Thread Memory - mainly each thread’s stack. We’ll mainly analyze thread stack space (in Chapter 5). Other thread management space is very small and can be ignored.
// Total reserved 669351KB, committed 41775KB
Thread (reserved=669351KB, committed=41775KB)
    (thread #653) // Current thread count is 653
    (stack: reserved=667648KB, committed=40072KB) // Thread stack space: we didn't specify Xss, default is 1MB, so reserved is 653 * 1024 = 667648KB, currently committed 40072KB for actual use
    (malloc=939KB #3932) // Total 939KB allocated through malloc system calls, 3932 malloc calls
    (arena=764KB #1304)  // Memory allocated through JVM internal Arena, total 764KB allocated, 1304 Arena allocation calls
5. JIT Compiler Space and Compiled Code Space - space occupied by the JIT compiler itself and space occupied by JIT-compiled code. This isn’t the focus of this article, so we won’t analyze it in detail.
Code (reserved=50742KB, committed=17786KB)
(malloc=1206KB #9495)
(mmap: reserved=49536KB, committed=16580KB)

Compiler (reserved=159KB, committed=159KB)
(malloc=29KB #813)
(arena=131KB #3)
6. Arena Data Structure Space - we see many arena-allocated memory in Native Memory Tracking. This is the space occupied by managing Arena data structures. This isn’t the focus of this article, so we won’t analyze it in detail.
Arena Chunk (reserved=187KB, committed=187KB)
(malloc=187KB)
7. JVM Tracing Memory - includes space occupied by JVM perf and JFR. JFR space usage might be quite large. This isn’t the focus of this article, so we won’t analyze it in detail.
Tracing (reserved=32KB, committed=32KB)
(arena=32KB #1)
8. JVM Logging Memory (logs specified by -Xlog parameter, and Java 17+ introduced asynchronous JVM logging -Xlog:async, buffers needed for asynchronous logging are also here). This isn’t the focus of this article, so we won’t analyze it in detail.
Logging (reserved=5KB, committed=5KB)
(malloc=5KB #216)
9. JVM Arguments Memory - we need to save and process current JVM parameters and various parameters passed when users start the JVM (sometimes called flags). This isn’t the focus of this article, so we won’t analyze it in detail.
Arguments (reserved=31KB, committed=31KB)
(malloc=31KB #90)
10. JVM Safepoint Memory - fixed two pages of memory (here one page is 4KB, we’ll analyze this page size related to the operating system in Chapter 2), used for JVM safepoint implementation, doesn’t change with JVM runtime memory usage. This isn’t the focus of this article, so we won’t analyze it in detail.
Safepoint (reserved=8KB, committed=8KB)
(mmap: reserved=8KB, committed=8KB)
11. Java Synchronization Mechanism Memory (e.g., synchronized, and AQS-based LockSupport) - memory occupied by underlying C++ data structures, internal system mutexes, etc. This isn’t the focus of this article, so we won’t analyze it in detail.
Synchronization (reserved=56KB, committed=56KB)
(malloc=56KB #789)
12. JVMTI Related Memory - JVMTI is the abbreviation for Java Virtual Machine Tool Interface. It’s part of the Java Virtual Machine (JVM), providing a set of APIs that allow developers to develop their own Java tools and agent programs to monitor, analyze, and debug Java applications. This memory is occupied by JVM for generating data after calling JVMTI APIs. This isn’t the focus of this article, so we won’t analyze it in detail.
Serviceability (reserved=1KB, committed=1KB)
(malloc=1KB #18)
13. Java String Deduplication Memory - Java string deduplication mechanism can reduce memory usage of string objects in applications. This mechanism has always performed poorly under certain GCs, especially G1GC and ZGC, so it’s disabled by default. Can be enabled with -XX:+UseStringDeduplication. This isn’t the focus of this article, so we won’t analyze it in detail.
String Deduplication (reserved=1KB, committed=1KB)
(malloc=1KB #8)
14. JVM GC Data Structures and Information Space - memory occupied by data structures and recorded information needed by JVM GC. This memory might be quite large, especially for low-latency focused GCs like ZGC. ZGC actually uses a space-for-time approach, increasing CPU consumption and memory usage while eliminating global pauses. This isn’t the focus of this article, so we won’t analyze it in detail.
GC (reserved=370980KB, committed=69260KB)
(malloc=28516KB #8340)
(mmap: reserved=342464KB, committed=40744KB)
15. JVM Internal and Other Usage - internal usage (usage not belonging to other categories) and other usage (not JVM itself but extra space occupied by certain OS system calls), won’t be very large.
Internal (reserved=1373KB, committed=1373KB)
(malloc=1309KB #6135)
(mmap: reserved=64KB, committed=64KB)

Other (reserved=12348KB, committed=12348KB)
(malloc=12348KB #14)
16. Native Memory Tracking Overhead - memory consumed by enabling Native Memory Tracking itself.
Native Memory Tracking (reserved=8426KB, committed=8426KB)
(malloc=325KB #4777)
(tracking overhead=8102KB)
1.4. Continuous Monitoring of Native Memory Tracking Summary Information#
Now JVM processes are generally deployed in cloud container orchestration environments like Kubernetes, where each JVM process memory is limited. If the limit is exceeded, OOMKiller will kill the JVM process. We generally only consider enabling NativeMemoryTracking to see which memory areas are consuming more and how to adjust when our JVM process is killed by OOMKiller.
OOMKiller uses a scoring system - your JVM process won’t be killed immediately upon exceeding limits, but points accumulate when exceeded, and when accumulated to a certain degree, it may be killed by OOMKiller. So we can capture the point where memory limits are exceeded for analysis by periodically outputting Native Memory Tracking summary information.
However, we cannot judge JVM memory usage solely based on Native Memory Tracking data, because as we’ll see in the analysis of JVM memory allocation and usage flow later, much of the memory allocated by JVM through mmap is first reserved, then committed, and only when actual data is written does it truly allocate physical memory. Also, JVM dynamically releases some memory, which may not be immediately reclaimed by the OS. Native Memory Tracking represents memory that JVM thinks it has requested from the OS, which differs from actual OS-allocated memory. So we can’t judge solely by viewing Native Memory Tracking; we also need to check indicators that reflect actual memory usage. Here we can check the Linux process monitoring file smaps_rollup to see specific memory usage, for example (generally don’t look at Rss because it can be inaccurate when multiple virtual addresses map to the same physical address, so mainly focus on Pss, but Pss updates aren’t real-time, but close enough - this can be understood as actual physical memory occupied by the process):
> cat /proc/23/smaps_rollup
689000000-fffff53a9000 ---p 00000000 00:00 0                             [rollup]
Rss:             5870852 kB
Pss:             5849120 kB
Pss_Anon:        5842756 kB
Pss_File:           6364 kB
Pss_Shmem:             0 kB
Shared_Clean:      27556 kB
Shared_Dirty:          0 kB
Private_Clean:       524 kB
Private_Dirty:   5842772 kB
Referenced:      5870148 kB
Anonymous:       5842756 kB
LazyFree:              0 kB
AnonHugePages:         0 kB
ShmemPmdMapped:        0 kB
FilePmdMapped:        0 kB
Shared_Hugetlb:        0 kB
Private_Hugetlb:       0 kB
Swap:                  0 kB
SwapPss:               0 kB
Locked:                0 kB
The author implements timed process memory monitoring by adding the following code to each Spring Cloud microservice process, mainly using smaps_rollup to view actual physical memory usage to find memory limit exceeded time points, and Native Memory Tracking to view JVM memory area usage for parameter optimization guidance.
import lombok.extern.log4j.Log4j2;
import org.apache.commons.io.FileUtils;
import org.springframework.boot.context.event.ApplicationReadyEvent;
import org.springframework.context.ApplicationListener;

import java.io.BufferedReader;
import java.io.File;
import java.io.IOException;
import java.io.InputStreamReader;
import java.util.List;
import java.util.concurrent.ScheduledThreadPoolExecutor;
import java.util.concurrent.TimeUnit;
import java.util.concurrent.atomic.AtomicBoolean;
import java.util.stream.Collectors;

import static org.springframework.cloud.bootstrap.BootstrapApplicationListener.BOOTSTRAP_PROPERTY_SOURCE_NAME;

@Log4j2
public class MonitorMemoryRSS implements ApplicationListener<ApplicationReadyEvent> {
    private static final AtomicBoolean INITIALIZED = new AtomicBoolean(false);

    private static final ScheduledThreadPoolExecutor sc = new ScheduledThreadPoolExecutor(1);


    @Override
    public void onApplicationEvent(ApplicationReadyEvent event) {
        if (isBootstrapContext(event)) {
            return;
        }
        synchronized (INITIALIZED) {
            if (INITIALIZED.get()) {
                return;
            }
            sc.scheduleAtFixedRate(() -> {
                long pid = ProcessHandle.current().pid();
                try {
                    // Read smaps_rollup
                    List<String> strings = FileUtils.readLines(new File("/proc/" + pid + "/smaps_rollup"));
                    log.info("MonitorMemoryRSS, smaps_rollup: {}", strings.stream().collect(Collectors.joining("\n")));
                    // Read Native Memory Tracking information
                    Process process = Runtime.getRuntime().exec(new String[]{"jcmd", pid + "", "VM.native_memory"});
                    try (BufferedReader reader = new BufferedReader(new InputStreamReader(process.getInputStream()))) {
                        log.info("MonitorMemoryRSS, native_memory: {}", reader.lines().collect(Collectors.joining("\n")));
                    }
                } catch (IOException e) {
                }

            }, 0, 30, TimeUnit.SECONDS);
            INITIALIZED.set(true);
        }
    }

    static boolean isBootstrapContext(ApplicationReadyEvent applicationEvent) {
        return applicationEvent.getApplicationContext().getEnvironment().getPropertySources().contains(BOOTSTRAP_PROPERTY_SOURCE_NAME);
    }
}
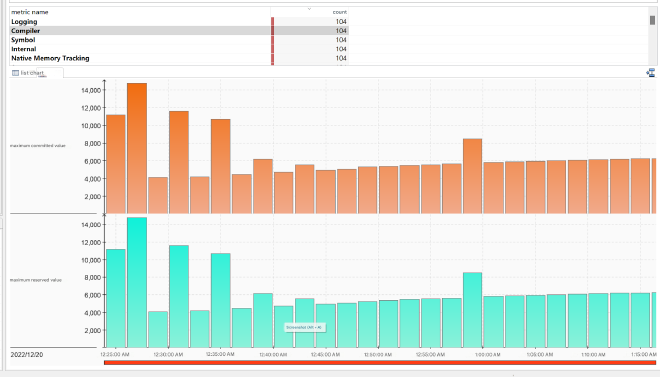
Additionally, the author abstracts these outputs as JFR events, with the effect shown in the image.
1.5. Why Memory Allocated in Native Memory Tracking is Divided into Reserved and Committed#
This will be analyzed in detail in Chapter 2.
2. JVM Memory Allocation and Usage Flow#
2.1. Brief Description of Linux Memory Management Model#
Linux memory management model isn’t the main focus of our series discussion. We’ll only briefly mention what we need to understand for this series.
CPUs access memory through addressing. Most current CPUs are 64-bit, meaning the addressing range is: 0x0000 0000 0000 0000 ~ 0xFFFF FFFF FFFF FFFF, capable of managing 16EB of memory. However, programs don’t directly access actual physical memory through CPU addressing, but through introducing MMU (Memory Management Unit) with an abstraction layer of virtual memory between CPU and actual physical addresses. This way, programs apply for and access virtual memory addresses, and MMU maps these virtual memory addresses to actual physical memory addresses. Also, to reduce memory fragmentation and increase memory allocation efficiency, Linux abstracts the concept of memory paging based on MMU, dividing virtual addresses into fixed-size pages (default 4K, if the platform supports more and larger page sizes, JVM can also utilize them, as we’ll see when analyzing related JVM parameters later), and when pages are actually used for writing data, mapping same-sized actual physical memory (page frames), or transferring some less frequently used pages to other storage devices like disks when physical memory is insufficient.
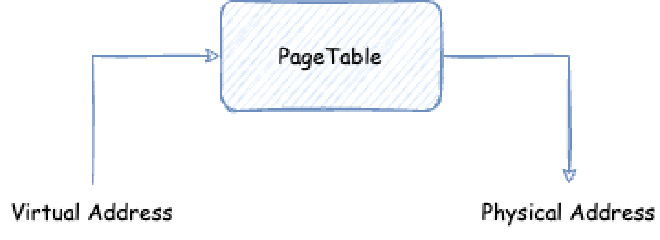
Generally, there are multiple processes using memory in a system, each process has its own independent virtual memory space. Assuming we have three processes here, process A’s accessed virtual address can be the same as process B and process C’s virtual addresses, so how does the OS distinguish them? How does the OS convert these virtual addresses to physical memory? This requires page tables. Page tables are also independent for each process. The OS will save physical memory in the process’s page table when mapping physical memory for processes to save user data. Then, when processes access virtual memory space, they find physical memory through page tables:
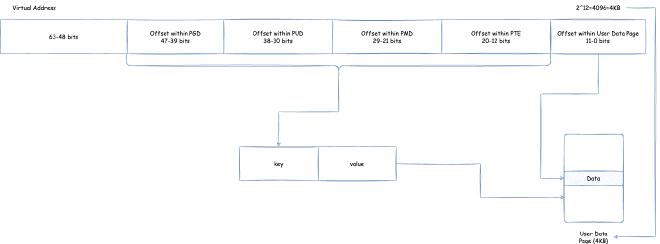
How do page tables convert a virtual memory address (we need to note that currently virtual memory addresses, user space and kernel space can use addresses from 0x0000 0000 0000 0000 ~ 0x0000 FFFF FFFF FFFF, i.e., 256TB) to physical memory? Below we show a four-level page table structure view in x86, 64-bit environment:
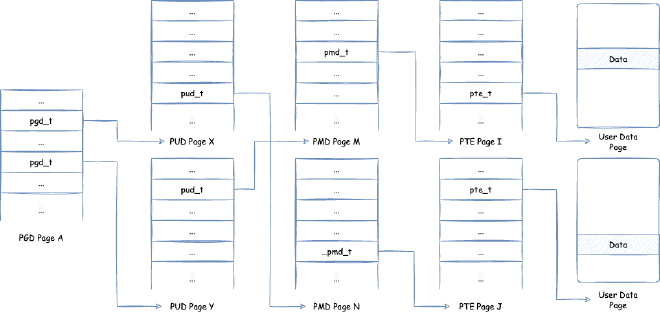
Here, page tables are divided into four levels: PGD (Page Global Directory), PUD (Page Upper Directory), PMD (Page Middle Directory), PTE (Page Table Entry). Each page table contains page table entries that save references to the next level page table, except the last level PTE contains page table entries that save pointers to user data memory. The process of finding corresponding user data memory through page tables using virtual memory addresses to read data is:
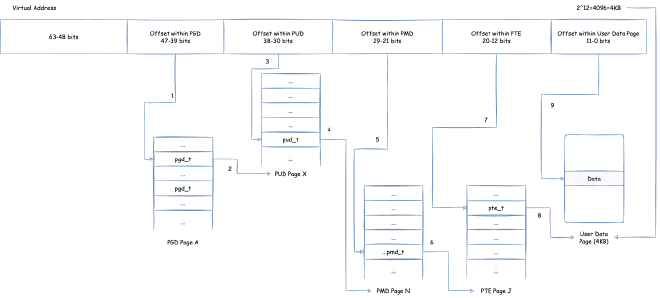
- Take bits
39 ~ 47of the virtual address (because user space and kernel space can use addresses from0x0000 0000 0000 0000 ~ 0x0000 FFFF FFFF FFFF, i.e., addresses below 47 bits) as offset, locate PGD page table entrypgd_tin the unique PGD page based on offset - Use
pgd_tto locate the specific PUD page - Take bits
30 ~ 38of the virtual address as offset, locate PUD page table entrypud_tin the corresponding PUD page based on offset - Use
pud_tto locate the specific PMD page - Take bits
21 ~ 29of the virtual address as offset, locate PMD page table entrypmd_tin the corresponding PMD page based on offset - Use
pmd_tto locate the specific PTE page - Take bits
12 ~ 20of the virtual address as offset, locate PTE page table entrypte_tin the corresponding PTE page based on offset - Use
pte_tto locate the specific user data physical memory page - Use the final bits
0 ~ 11as offset, corresponding to the corresponding offset in the user data physical memory page
If every virtual memory access requires accessing this page table to translate to actual physical memory, performance would be too poor. So generally CPUs have a TLB (Translation Lookaside Buffer) inside, usually part of the CPU’s MMU. TLB is responsible for caching the mapping relationship between virtual memory and actual physical memory, and TLB capacity is generally very small. Every virtual memory access first checks if there’s a cache in TLB, and only queries the page table if there isn’t.
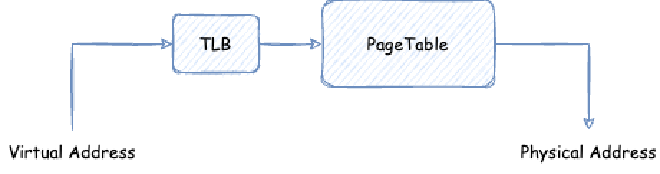
By default, TLB caches with key as bits 12 ~ 47 of the address, value is the actual physical memory page. This way steps 1 to 7 above can be replaced with accessing TLB:
- Take bits
12 ~ 47of the virtual address as key, access TLB, locate the specific user data physical memory page. - Use the final bits
0 ~ 11as offset, corresponding to the corresponding offset in the user data physical memory page.
TLB is generally very small. Let’s look at TLB sizes in several CPUs.
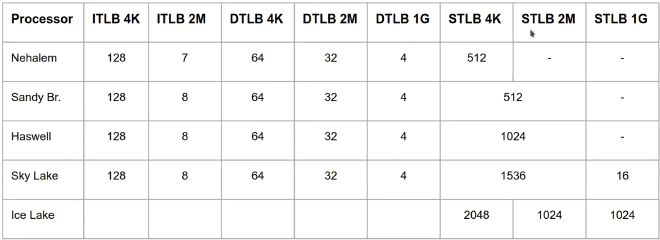
We don’t need to care about what iTLB, dTLB, sTLB mean specifically, just see two points: 1. TLB can overall accommodate a small number; 2. The larger the page size, the fewer TLB can accommodate. But overall, the page size TLB can accommodate still increases (for example, Nehalem’s iTLB, when page size is 4K, can accommodate a total of 128 * 4 = 512K memory, when page size is 2M, can accommodate a total of 2 * 7 = 14M memory).
JVM needs to know page size in many places. During JVM initialization, it reads the page size through system call sysconf(_SC_PAGESIZE) and saves it for subsequent use. Reference source code: https://github.com/openjdk/jdk/blob/jdk-21%2B3/src/hotspot/os/linux/os_linux.cpp:
    // Set global default page size, can get global default page size through Linux::page_size()
    Linux::set_page_size(sysconf(_SC_PAGESIZE));
    if (Linux::page_size() == -1) {
        fatal("os_linux.cpp: os::init: sysconf failed (%s)",
          os::strerror(errno));
    }
    // Add default page size to optional page size list, useful when involving large page allocation
    _page_sizes.add(Linux::page_size());
2.2. JVM Main Memory Allocation Process#
Step 1: Each JVM subsystem (such as Java heap, metaspace, JIT code cache, GC, etc.), if needed, first reserves the maximum limit size of the memory area to be allocated during initialization (this maximum size needs to be aligned to page size (i.e., an integer multiple of page size), default page size is the aforementioned Linux::page_size()). For example, for Java heap, it’s the maximum heap size (limited by -Xmx or -XX:MaxHeapSize), and for code cache, it’s also the maximum code cache size (limited by -XX:ReservedCodeCacheSize). The purpose of Reserve is to allocate a block of memory in virtual memory space specifically for a certain area. The benefits of doing this are:
- Isolate the virtual space of memory used by each JVM subsystem, so when there are bugs in JVM code (such as Segment Fault exceptions), the problematic subsystem can be quickly located through the virtual memory address in the error report.
- Can conveniently limit the maximum memory size used by this area.
- Easy to manage. Reserve doesn’t trigger the OS to allocate mapped actual physical memory, this area can expand and contract as needed within the Reserved area.
- Convenient for some JIT optimizations, for example, we deliberately reserve this area but deliberately don’t map the virtual memory of this area to physical memory, accessing this memory will cause Segment Fault exceptions. JVM will preset Segment Fault exception handlers, in the handler check which subsystem’s Reserved area the memory address that caused the Segment Fault exception belongs to, and determine what operation to do. Later we’ll see that null check optimization throwing
NullPointerExceptionexceptions, global safepoints, and throwingStackOverflowErrorimplementations are all related to this mechanism.
In Linux environment, Reserve is implemented through mmap(2) system call, passing parameter prot = PROT_NONE. PROT_NONE means it won’t be used, i.e., no operations including read and write are allowed. If JVM uses this memory, a Segment Fault exception will occur. The source code for Reserve corresponds to:
Entry point: https://github.com/openjdk/jdk/blob/jdk-21+9/src/hotspot/share/runtime/os.cpp
char* os::reserve_memory(size_t bytes, bool executable, MEMFLAGS flags) {
  // Call different pd_reserve_memory functions for each operating system to perform reserve
  char* result = pd_reserve_memory(bytes, executable);
  if (result != NULL) {
    MemTracker::record_virtual_memory_reserve(result, bytes, CALLER_PC, flags);
  }
  return result;
}
The Linux implementation corresponds to: https://github.com/openjdk/jdk/blob/jdk-21+9/src/hotspot/os/linux/os_linux.cpp
char* os::pd_reserve_memory(size_t bytes, bool exec) {
  return anon_mmap(nullptr, bytes);
}

static char* anon_mmap(char* requested_addr, size_t bytes) {
  const int flags = MAP_PRIVATE | MAP_NORESERVE | MAP_ANONYMOUS;
  // The key here is PROT_NONE, representing only reservation in virtual space, not actually mapping physical memory
  // fd passed is -1, because there's no actual file mapping, our purpose here is to allocate memory, not map a file to memory
  char* addr = (char*)::mmap(requested_addr, bytes, PROT_NONE, flags, -1, 0);
  return addr == MAP_FAILED ? NULL : addr;
}
Step 2: Each JVM subsystem, according to their respective strategies, extends memory by Committing part of the Reserved area from Step 1 (size also generally page-size aligned) to request physical memory mapping from the OS, and releases physical memory to the OS by Uncommitting already Committed memory.
The source code entry for Commit: https://github.com/openjdk/jdk/blob/jdk-21+9/src/hotspot/share/runtime/os.cpp
bool os::commit_memory(char* addr, size_t bytes, bool executable) {
  assert_nonempty_range(addr, bytes);
  // Call different pd_commit_memory functions for each operating system to perform commit
  bool res = pd_commit_memory(addr, bytes, executable);
  if (res) {
    MemTracker::record_virtual_memory_commit((address)addr, bytes, CALLER_PC);
  }
  return res;
}
The Linux implementation corresponds to: https://github.com/openjdk/jdk/blob/jdk-21+9/src/hotspot/os/linux/os_linux.cpp
bool os::pd_commit_memory(char* addr, size_t size, bool exec) {
  return os::Linux::commit_memory_impl(addr, size, exec) == 0;
}

int os::Linux::commit_memory_impl(char* addr, size_t size, bool exec) {
  // The key here is PROT_READ|PROT_WRITE, i.e., requesting to read and write this memory
  int prot = exec ? PROT_READ|PROT_WRITE|PROT_EXEC : PROT_READ|PROT_WRITE;
  uintptr_t res = (uintptr_t) ::mmap(addr, size, prot,
                                     MAP_PRIVATE|MAP_FIXED|MAP_ANONYMOUS, -1, 0);
  if (res != (uintptr_t) MAP_FAILED) {
    if (UseNUMAInterleaving) {
      numa_make_global(addr, size);
    }
    return 0;
  }

  int err = errno;  // save errno from mmap() call above

  if (!recoverable_mmap_error(err)) {
    warn_fail_commit_memory(addr, size, exec, err);
    vm_exit_out_of_memory(size, OOM_MMAP_ERROR, "committing reserved memory.");
  }

  return err;
}
After Committing memory, the OS doesn’t immediately allocate physical memory, but only allocates memory when writing data to the Committed memory. JVM has a corresponding parameter that can immediately write 0 after Committing memory to force the OS to allocate memory, which is the AlwaysPreTouch parameter. We’ll analyze this parameter in detail later, including defects in historical versions.
Let’s see why Reserve first then Commit is good for debugging. Look at this example: if we don’t have Step 1 Reserve and directly do Step 2 Commit, then we might allocate memory like this:
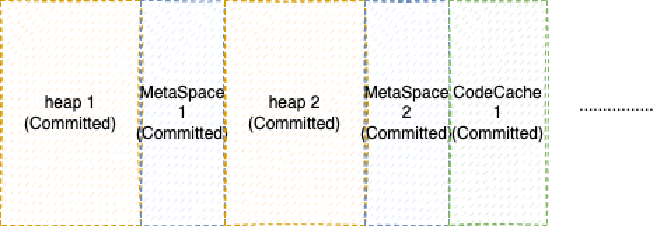
Suppose at this time, we accidentally wrote a bug in JVM that caused MetaSpace 2 memory to be reclaimed, then pointers pointing to MetaSpace 2 memory will report Segment Fault. But through the address in Segment Fault, we don’t know which area this address belongs to, unless we have another memory structure saving a list of memory Committed by each subsystem, but this is too inefficient. If we Reserve large blocks first then Commit inside them, the situation is different:
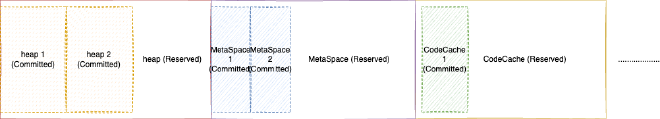
This way, just by judging the range where the address in Segment Fault is located, we can know which subsystem it is.
2.2.1. Difference Between JVM Committed Memory and Actual Occupied Memory#
In the previous section, we learned that large blocks of memory in JVM are basically first reserved in large chunks, then commit the needed small chunks, then start reading and writing to process memory. In Linux environment, this is implemented based on mmap(2). But note that after committing, memory isn’t immediately allocated physical memory, but only when actually storing things in memory does it truly map physical memory. Loading reads might also not map physical memory.
This is actually a phenomenon you might see but ignore in daily life. If you’re using SerialGC, ParallelGC, or CMS GC, old generation memory might not map physical memory before objects are promoted to old generation, although this memory has been committed. And young generation might also map physical memory as it’s used. If you’re using ZGC, G1GC, or ShenandoahGC, memory usage will be more aggressive (mainly due to memory being written due to partitioning algorithm division), this is one of the reasons you see rapid physical memory growth after switching GCs. JVM has a corresponding parameter that can immediately write 0 after Committing memory to force the OS to allocate memory, which is the AlwaysPreTouch parameter. We’ll analyze this parameter in detail later, including defects in historical versions. Other differences mainly come from the system possibly not having time to truly reclaim this physical memory after uncommitting.
So, memory that JVM thinks it has committed and actual physical memory allocated by the system might differ - JVM might think it has committed more memory than the system has allocated physical memory, or it might be less. This is why Native Memory Tracking (memory JVM thinks it has committed) doesn’t match actual physical memory usage indicators in other system monitoring.
2.3. Large Page Allocation UseLargePages#
We mentioned earlier that virtual memory needs to map physical memory to be usable, and this mapping relationship is saved in page tables in memory. Modern CPU architectures generally have TLB (Translation Lookaside Buffer, also called page table register buffer) that saves frequently used page table mapping entries. TLB size is limited, generally TLB can only accommodate less than 100 page table mapping entries. If we can keep all page table mapping entries corresponding to program virtual memory in TLB, it can greatly improve program performance. This requires minimizing the number of page table mapping entries: Number of page table entries = Program required memory size / Page size. We either reduce program required memory or increase page size. We generally consider increasing page size, which is the origin of large page allocation. JVM also supports large page allocation for heap memory allocation to optimize large heap memory allocation. So what large page allocation methods are available in Linux environment?
2.3.1. Linux Large Page Allocation Method - Huge Translation Lookaside Buffer Page (hugetlbfs)#
Related Linux kernel documentation: https://www.kernel.org/doc/Documentation/vm/hugetlbpage.txt
This is an earlier large page allocation method, essentially working on the page table mapping mentioned earlier:
Default 4K page size:
PMD directly maps actual physical pages, page size is 4K * 2^9 = 2M: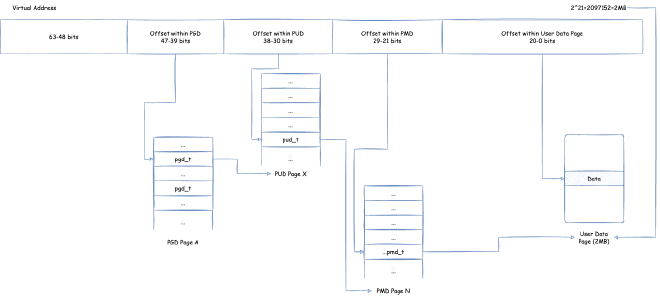
PUD directly maps actual physical pages, page size is 2M * 2^9 = 1G: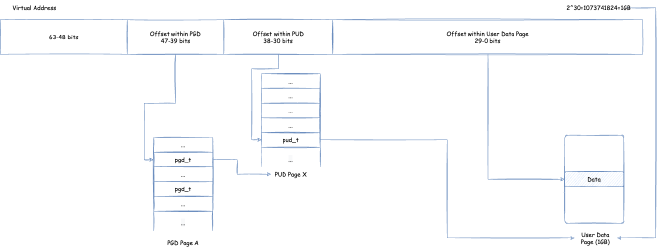
However, to use this feature, the OS needs to enable CONFIG_HUGETLBFS and CONFIG_HUGETLB_PAGE when building. After that, large pages are usually pre-allocated by system management control and put into a pool. Then, large page allocation can be used to request memory from the pool through mmap system calls or shmget,shmat SysV shared memory system calls.
This large page allocation method requires the system to preset enabling large pages and pre-allocate large pages. It also has some invasiveness to code, lacking flexibility. But the benefit is more controllable performance. Another very flexible Transparent Huge Pages (THP) method can always have some unexpected performance situations.
2.3.2. Linux Large Page Allocation Method - Transparent Huge Pages (THP)#
Related Linux kernel documentation: https://www.kernel.org/doc/Documentation/vm/transhuge.txt
THP is a second method of using large pages that supports automatic page size upgrade and downgrade, making it very flexible with basically no invasiveness to user code. But as mentioned earlier, this system’s automatic page size upgrade and downgrade, and the system’s general consideration of versatility, can lead to unexpected performance bottlenecks in certain situations.
2.3.3. JVM Large Page Allocation Related Parameters and Mechanisms#
Related parameters are as follows:
UseLargePages: Explicitly specifies whether to enable large page allocation. If disabled, the parameters below won’t take effect. Default is false on Linux.UseHugeTLBFS: Explicitly specifies whether to use the first large page allocation method hugetlbfs and allocate memory throughmmapsystem calls. Default is false on Linux.UseSHM: Explicitly specifies whether to use the first large page allocation method hugetlbfs and allocate memory throughshmget,shmatsystem calls. Default is false on Linux.UseTransparentHugePages: Explicitly specifies whether to use the second large page allocation method THP. Default is false on Linux.LargePageSizeInBytes: Specifies explicit large page size, only applicable to the first large page allocation method hugetlbfs, and must belong to OS-supported page sizes or won’t take effect. Default is 0, meaning not specified.
First, we need to make a simple judgment on the above parameters: if UseLargePages isn’t specified, then use the corresponding system’s default UseLargePages value. On Linux it’s false, so large page allocation won’t be enabled. If startup parameters explicitly specify UseLargePages not to enable, then large page allocation also won’t be enabled. If reading /proc/meminfo to get default large page size can’t be read or is 0, it means the system doesn’t support large page allocation, and large page allocation also won’t be enabled.
So if large page allocation is enabled, we need to initialize and verify the feasibility of large page allocation parameters. The process is:
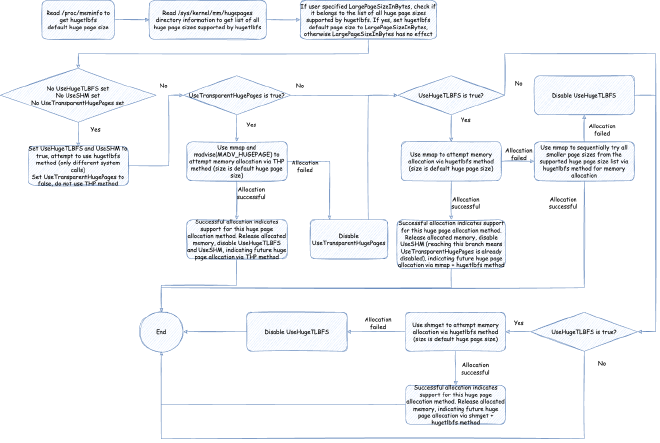
First, JVM will read supported page sizes according to the current platform and system environment. Of course, this is for the first large page allocation method hugetlbfs. In Linux environment, JVM will read the default Hugepagesize from /proc/meminfo, and retrieve all supported large page sizes from the /sys/kernel/mm/hugepages directory. This can be referenced in source code: https://github.com/openjdk/jdk/blob/jdk-21%2B3/src/hotspot/os/linux/os_linux.cpp. For detailed information about these files or directories, please refer to the Linux kernel documentation mentioned in previous sections: https://www.kernel.org/doc/Documentation/vm/hugetlbpage.txt
If the OS has enabled hugetlbfs, the structure under /sys/kernel/mm/hugepages directory is similar to:
> tree /sys/kernel/mm/hugepages

/sys/kernel/mm/hugepages
├── hugepages-1048576kB
│   ├── free_hugepages
│   ├── nr_hugepages
│   ├── nr_hugepages_mempolicy
│   ├── nr_overcommit_hugepages
│   ├── resv_hugepages
│   └── surplus_hugepages
└── hugepages-2048kB
    ├── free_hugepages
    ├── nr_hugepages
    ├── nr_hugepages_mempolicy
    ├── nr_overcommit_hugepages
    ├── resv_hugepages
    └── surplus_hugepages
This hugepages-1048576kB represents support for 1GB page size, hugepages-2048kB represents support for 2KB page size.
If UseHugeTLBFS, UseSHM, and UseTransparentHugePages aren’t set, it actually follows the default, which defaults to using hugetlbfs method, not THP method, because as mentioned earlier, THP can have unexpected performance bottlenecks in certain scenarios, and in large applications, stability takes priority over peak performance. After that, it defaults to trying UseHugeTLBFS first (i.e., using mmap system calls through hugetlbfs method for large page allocation), then trying UseSHM if that doesn’t work (i.e., using shmget system calls through hugetlbfs method for large page allocation). This just verifies whether these large page memory allocation methods are available; only when available will those usable large page memory allocation methods be adopted when actually allocating memory later.
3. Java Heap Memory Related Design#
3.1. General Initialization and Extension Process#
Currently, the latest JVM mainly initializes the heap and extends or shrinks the heap based on three indicators:
- Maximum heap size
- Minimum heap size
- Initial heap size
Under different GC situations, the initialization and extension processes might differ in some details, but the general approach is:
- During initialization phase, reserve maximum heap size and commit initial heap size
- During certain phases of certain GCs, dynamically extend or shrink heap size based on data from the last GC. Extension means committing more, shrinking means uncommitting part of the memory. However, heap size won’t be smaller than minimum heap size and won’t be larger than maximum heap size
3.2. Direct Specification of Three Indicators (MinHeapSize, MaxHeapSize, InitialHeapSize)#
These three indicators directly correspond to JVM parameters:
- Maximum heap size:
MaxHeapSize, if not specified there will be a default preset value to guide JVM calculation of these indicator sizes. The next section will analyze in detail, preset value is around 125MB (96M*13/10) - Minimum heap size:
MinHeapSize, default is 0, 0 means let JVM calculate itself, next section will analyze in detail - Initial heap size:
InitialHeapSize, default is 0, 0 means let JVM calculate itself, next section will analyze in detail
Corresponding source code: https://github.com/openjdk/jdk/blob/jdk-21+3/src/hotspot/share/gc/shared/gc_globals.hpp:
#define ScaleForWordSize(x) align_down((x) * 13 / 10, HeapWordSize)

product(size_t, MaxHeapSize, ScaleForWordSize(96*M),                \
  "Maximum heap size (in bytes)")                                   \
  constraint(MaxHeapSizeConstraintFunc,AfterErgo)                   \
product(size_t, MinHeapSize, 0,                                     \
  "Minimum heap size (in bytes); zero means use ergonomics")        \
  constraint(MinHeapSizeConstraintFunc,AfterErgo)                   \
product(size_t, InitialHeapSize, 0,                                 \
  "Initial heap size (in bytes); zero means use ergonomics")        \
  constraint(InitialHeapSizeConstraintFunc,AfterErgo)               \
We can set these three indicators through startup parameters like -XX:MaxHeapSize=1G, but we often see Xmx and Xms parameters for setting these three indicators. These two parameters correspond to:
Xmx: Corresponds to maximum heap size, equivalent toMaxHeapSizeXms: Equivalent to setting both minimum heap sizeMinHeapSizeand initial heap sizeInitialHeapSize
Corresponding JVM source code: https://github.com/openjdk/jdk/blob/jdk-21+3/src/hotspot/share/runtime/arguments.cpp:
//If Xms is set
else if (match_option(option, "-Xms", &tail)) {
  julong size = 0;
  //Parse Xms size
  ArgsRange errcode = parse_memory_size(tail, &size, 0);
  if (errcode != arg_in_range) {
    jio_fprintf(defaultStream::error_stream(),
                "Invalid initial heap size: %s\n", option->optionString);
    describe_range_error(errcode);
    return JNI_EINVAL;
  }
  //Set parsed value to MinHeapSize
  if (FLAG_SET_CMDLINE(MinHeapSize, (size_t)size) != JVMFlag::SUCCESS) {
    return JNI_EINVAL;
  }
  //Set parsed value to InitialHeapSize
  if (FLAG_SET_CMDLINE(InitialHeapSize, (size_t)size) != JVMFlag::SUCCESS) {
    return JNI_EINVAL;
  }
//If Xmx is set
} else if (match_option(option, "-Xmx", &tail) || match_option(option, "-XX:MaxHeapSize=", &tail)) {
  julong long_max_heap_size = 0;
  //Parse Xmx size
  ArgsRange errcode = parse_memory_size(tail, &long_max_heap_size, 1);
  if (errcode != arg_in_range) {
    jio_fprintf(defaultStream::error_stream(),
                "Invalid maximum heap size: %s\n", option->optionString);
    describe_range_error(errcode);
    return JNI_EINVAL;
  }
  //Set parsed value to MaxHeapSize
  if (FLAG_SET_CMDLINE(MaxHeapSize, (size_t)long_max_heap_size) != JVMFlag::SUCCESS) {
    return JNI_EINVAL;
  }
}
Finally, JVM startup parameters can appear multiple times for the same parameter, but only the last one takes effect, for example:
java -XX:MaxHeapSize=8G -XX:MaxHeapSize=4G -XX:MaxHeapSize=8M -version
This command starts JVM with MaxHeapSize of 8MB. Since Xmx is equivalent to MaxHeapSize as mentioned earlier, this can also be written (though MaxHeapSize is still 8MB in the end):
java -Xmx=8G -XX:MaxHeapSize=4G -XX:MaxHeapSize=8M -version
3.3. How These Three Indicators (MinHeapSize, MaxHeapSize, InitialHeapSize) are Calculated When Not Manually Specified#
In the previous section, we mentioned we can manually specify these three parameters. What if we don’t specify them? How does JVM calculate the size of these three indicators?
First, of course, JVM needs to read JVM available memory: First, JVM needs to know how much memory it can use, which we call available memory. This introduces the first JVM parameter, MaxRAM, which is used to explicitly specify the available memory size for the JVM process. If not specified, JVM will read the system available memory itself. This available memory is used to guide JVM in limiting maximum heap memory. Later we’ll see many JVM parameters related to this available memory.
We mentioned earlier that even if MaxHeapSize or Xmx isn’t specified, MaxHeapSize has its own preset reference value. In source code, this preset reference value is around 125MB (96M*13/10). But generally the final value won’t be based on this reference value, JVM has very complex calculations during initialization to calculate appropriate values. For example, you can execute the following command on your computer and see output similar to below:
>  java -XX:+UnlockDiagnosticVMOptions -XX:+PrintFlagsFinal -version|grep MaxHeapSize
   size_t MaxHeapSize                              = 1572864000                                {product} {ergonomic}
   size_t SoftMaxHeapSize                          = 1572864000                             {manageable} {ergonomic}
openjdk version "17.0.2" 2022-01-18 LTS
OpenJDK Runtime Environment Corretto-17.0.2.8.1 (build 17.0.2+8-LTS)
OpenJDK 64-Bit Server VM Corretto-17.0.2.8.1 (build 17.0.2+8-LTS, mixed mode, sharing)
You can see the MaxHeapSize size and that its value is determined by ergonomic, meaning it’s calculated by JVM itself rather than manually specified.
The 125MB initial reference value mentioned above is generally used for JVM calculations. Let’s analyze this calculation process, starting with the MaxHeapSize calculation process:
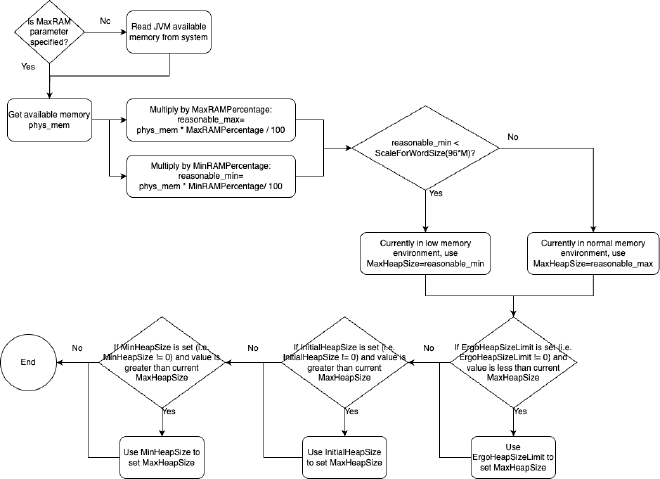
The process involves the following parameters, and some deprecated parameters that will be converted to non-deprecated parameters:
MinRAMPercentage: Don’t be misled by the name, this parameter takes effect when available memory is relatively small, i.e., maximum heap memory usage is this parameter’s specified percentage of available memory, default is 50, i.e., 50%MaxRAMPercentage: Don’t be misled by the name, this parameter takes effect when available memory is relatively large, i.e., maximum heap memory usage is this parameter’s specified percentage of available memory, default is 25, i.e., 25%ErgoHeapSizeLimit: Through automatic calculation, the calculated maximum heap memory size doesn’t exceed this parameter’s specified size, default is 0 meaning no limitMinRAMFraction: Deprecated, if configured will be converted toMinRAMPercentagewith conversion relationship:MinRAMPercentage= 100.0 /MinRAMFraction, default is 2MaxRAMFraction: Deprecated, if configured will be converted toMaxRAMPercentagewith conversion relationship:MaxRAMPercentage= 100.0 /MaxRAMFraction, default is 4
Corresponding source code: https://github.com/openjdk/jdk/blob/jdk-21+3/src/hotspot/share/gc/shared/gc_globals.hpp:
product(double, MinRAMPercentage, 50.0,                             \
  "Minimum percentage of real memory used for maximum heap"         \
  "size on systems with small physical memory size")                \
  range(0.0, 100.0)                                                 \
product(double, MaxRAMPercentage, 25.0,                             \
  "Maximum percentage of real memory used for maximum heap size")   \
  range(0.0, 100.0)                                                 \
product(size_t, ErgoHeapSizeLimit, 0,                               \
  "Maximum ergonomically set heap size (in bytes); zero means use " \
  "MaxRAM * MaxRAMPercentage / 100")                                \
  range(0, max_uintx)                                               \
product(uintx, MinRAMFraction, 2,                                   \
  "Minimum fraction (1/n) of real memory used for maximum heap "    \
  "size on systems with small physical memory size. "               \
  "Deprecated, use MinRAMPercentage instead")                       \
  range(1, max_uintx)                                               \
product(uintx, MaxRAMFraction, 4,                                   \
  "Maximum fraction (1/n) of real memory used for maximum heap "    \
  "size. "                                                          \
  "Deprecated, use MaxRAMPercentage instead")                       \
  range(1, max_uintx)                                               \
Then if we also haven’t set MinHeapSize and InitialHeapSize, they will also go through the following calculation process:
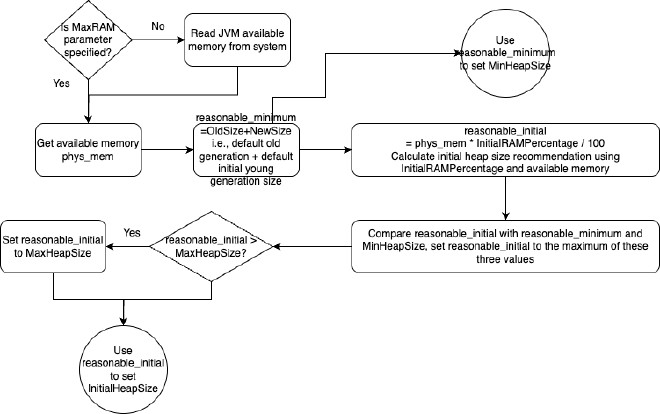
The process involves the following parameters, and some deprecated parameters that will be converted to non-deprecated parameters:
NewSize: Initial young generation size, preset value is around 1.3MB (1*13/10)OldSize: Old generation size, preset value is around 5.2MB (4*13/10)InitialRAMPercentage: Initial heap memory is this parameter’s specified percentage of available memory, default is 1.5625, i.e., 1.5625%InitialRAMFraction: Deprecated, if configured will be converted toInitialRAMPercentagewith conversion relationship:InitialRAMPercentage= 100.0 /InitialRAMFraction
Corresponding source code: https://github.com/openjdk/jdk/blob/jdk-21+3/src/hotspot/share/gc/shared/gc_globals.hpp:
product(size_t, NewSize, ScaleForWordSize(1*M),                     \
  "Initial new generation size (in bytes)")                         \
  constraint(NewSizeConstraintFunc,AfterErgo)                       \
product(size_t, OldSize, ScaleForWordSize(4*M),                     \
  "Initial tenured generation size (in bytes)")                     \
  range(0, max_uintx)                                               \
product(double, InitialRAMPercentage, 1.5625,                       \
  "Percentage of real memory used for initial heap size")           \
  range(0.0, 100.0)                                                 \
product(uintx, InitialRAMFraction, 64,                              \
  "Fraction (1/n) of real memory used for initial heap size. "      \
  "Deprecated, use InitialRAMPercentage instead")                   \
  range(1, max_uintx)                                               \
3.4. Compressed Object Pointer Related Mechanism - UseCompressedOops#
3.4.1. Significance of Compressed Object Pointers#
Most modern machines are 64-bit, and JVM has only provided 64-bit virtual machines since version 9. In JVM, an object pointer corresponds to the starting position of the virtual memory where the process stores this object, also 64-bit in size:
We know that for 32-bit addressing, it only supports addressing up to 4GB of memory, which might not be enough for current JVMs where heap size alone might exceed 4GB. So currently object pointers are generally 64-bit to support large memory. However, compared to 32-bit pointer addressing, performance degrades. We know CPUs can only process data in registers, and between registers and memory, there are many levels of CPU cache. Although memory is getting cheaper and larger, CPU cache hasn’t gotten larger, which means if using 64-bit pointer addressing compared to previous 32-bit, CPU cache can hold half the number of pointers.
Java is an object-oriented language, and the most frequent operations in JVM are operations on objects, such as loading an object’s field, storing an object’s field, all of which require accessing object pointers. So JVM wants to optimize object pointers as much as possible, which introduces compressed object pointers, allowing object pointers to remain 32-bit when conditions are met.
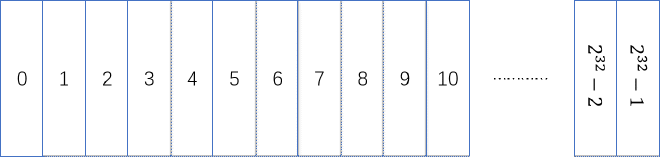
For 32-bit pointers, assuming each 1 represents 1 byte, then it can describe 0~2^32-1, these 2^32 bytes, which is 4 GB of virtual memory.
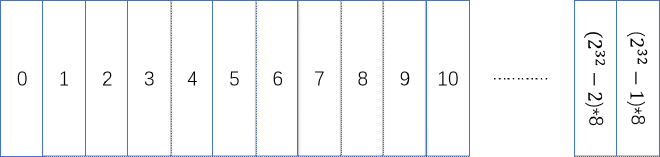
What if I let each 1 represent 8 bytes? That is, make this virtual memory 8-byte aligned, meaning when I use this memory, the minimum allocation unit is 8 bytes. For Java heap memory, this means an object’s occupied space must be a multiple of 8 bytes; if not enough, it will be padded to a multiple of 8 bytes to ensure alignment. This way it can describe at most 2^32 * 8 bytes, which is 32 GB of virtual memory.
This is the principle of compressed pointers. The related JVM parameter mentioned above is: ObjectAlignmentInBytes, which indicates how many bytes each object in the Java heap needs to be aligned to, i.e., how many bytes the heap is aligned to. Value range is 8 ~ 256, must be a power of 2, because powers of 2 can simplify many operations, for example, taking remainder with powers of 2 can be simplified to bitwise AND operations with powers of 2 minus 1, and multiplication and division can be simplified to shift operations.
If the configured maximum heap memory exceeds 32 GB (when JVM is 8-byte aligned), compressed pointers will become ineffective (actually not exceeding 32GB, it will become ineffective when slightly less than 32GB, there are other factors affecting this, which will be discussed in the next section). However, this 32 GB is related to byte alignment size, which is the size configured by -XX:ObjectAlignmentInBytes=8 (default is 8 bytes, meaning Java defaults to 8-byte alignment). If you configure -XX:ObjectAlignmentInBytes=16, then compressed pointers won’t become ineffective until maximum heap memory exceeds 64 GB. If you configure -XX:ObjectAlignmentInBytes=32, then compressed pointers won’t become ineffective until maximum heap memory exceeds 128 GB.
3.4.2. Evolution of Relationship Between Compressed Object Pointers and Compressed Class Pointers#
In older versions, UseCompressedClassPointers depended on UseCompressedOops, meaning if compressed object pointers weren’t enabled, compressed class pointers couldn’t be enabled either. But starting from Java 15 Build 23, UseCompressedClassPointers no longer depends on UseCompressedOops, and the two have become independent in most cases. Except when using JVM Compiler Interface (such as using GraalVM) on x86 CPUs. Reference JDK ISSUE: https://bugs.openjdk.java.net/browse/JDK-8241825 - Make compressed oops and compressed class pointers independent (x86_64, PPC, S390) and source code:
https://github.com/openjdk/jdk/blob/jdk-21%2B3/src/hotspot/cpu/x86/globalDefinitions_x86.hpp:#define COMPRESSED_CLASS_POINTERS_DEPENDS_ON_COMPRESSED_OOPS EnableJVMCIOn x86 CPU, whetherUseCompressedClassPointersdepends onUseCompressedOopsdepends on whether JVMCI is enabled. In default JVM releases, EnableJVMCI is falsehttps://github.com/openjdk/jdk/blob/jdk-21%2B3/src/hotspot/cpu/arm/globalDefinitions_arm.hpp:#define COMPRESSED_CLASS_POINTERS_DEPENDS_ON_COMPRESSED_OOPS falseOn ARM CPU,UseCompressedClassPointersdoesn’t depend onUseCompressedOopshttps://github.com/openjdk/jdk/blob/jdk-21%2B3/src/hotspot/cpu/ppc/globalDefinitions_ppc.hpp:#define COMPRESSED_CLASS_POINTERS_DEPENDS_ON_COMPRESSED_OOPS falseOn PPC CPU,UseCompressedClassPointersdoesn’t depend onUseCompressedOopshttps://github.com/openjdk/jdk/blob/jdk-21%2B3/src/hotspot/cpu/s390/globalDefinitions_s390.hpp:#define COMPRESSED_CLASS_POINTERS_DEPENDS_ON_COMPRESSED_OOPS falseOn S390 CPU,UseCompressedClassPointersdoesn’t depend onUseCompressedOops
3.4.3. Different Modes and Addressing Optimization Mechanisms of Compressed Object Pointers#
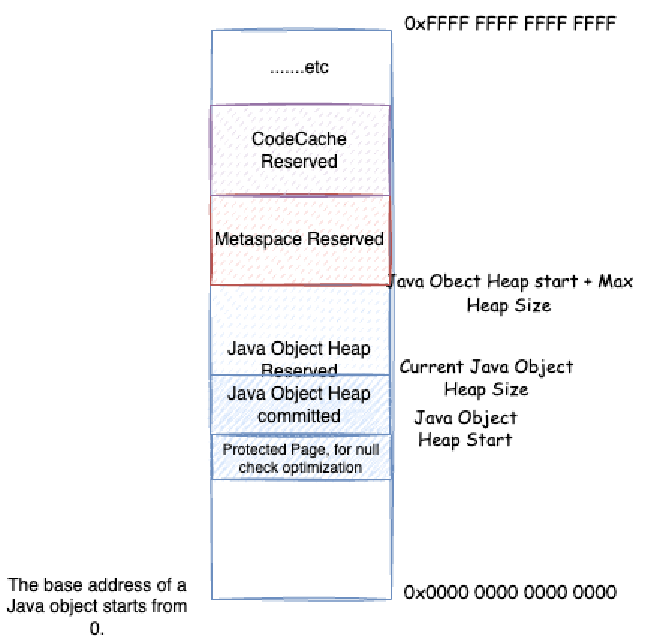
How do object pointers and compressed object pointers convert? Let’s think about some questions first. Through the analysis in Chapter 2, we know that each process has its own virtual address space, and some low-bit space starting from 0 is reserved space for the process’s system calls, for example, 0x0000 0000 0000 0000 ~ 0x0000 0000 0040 0000 is a reserved area that cannot be used
The space that processes can apply for is the native heap space shown in the figure above. So, the virtual memory space of JVM processes definitely won’t start from 0x0000 0000 0000 0000. Different operating systems have different starting points for this native heap space. We don’t care about the specific location here, we only know one thing: JVM needs to apply for memory starting from a certain point in virtual memory, and needs to reserve enough space for possible system call mechanisms, such as some malloc memory we saw in native memory tracking earlier, some of which are actually allocated in this reserved space. Generally, JVM will prioritize considering Java heap memory allocation in native heap, then allocate others in native heap, such as metaspace, code cache space, etc.
When JVM reserves and allocates Java heap space, it will reserve the maximum Java heap space size at once, then reserve and allocate other storage spaces based on this. After that, when allocating Java objects, it commits within the reserved Java heap memory space, then writes data to map physical memory to allocate Java objects. According to the Java heap size expansion and contraction strategy mentioned earlier, it decides whether to continue committing to occupy more physical memory or uncommit to release physical memory:
Java is an object-oriented language, and the most frequent execution in JVM is accessing these objects. In various JVM mechanisms, we must constantly consider how to optimize the speed of accessing these objects. For compressed object pointers, JVM has considered many optimizations. If we want to use compressed object pointers, we need to convert this 64-bit address to a 32-bit address. Then when reading object information pointed to by compressed object pointers, we need to parse this 32-bit address to a 64-bit address before addressing and reading. The conversion formula is as follows:
64-bit address = base address + (compressed object pointer << object alignment offset)compressed object pointer = (64-bit address - base address) >> object alignment offset
The base address is actually the starting point of object addresses. Note that this base address is not necessarily the starting address of the Java heap, as we’ll see later. The object alignment offset is related to the aforementioned ObjectAlignmentInBytes, for example, in the case of ObjectAlignmentInBytes=8, the object alignment offset is 3 (because 8 is 2 to the power of 3). We optimize this formula:
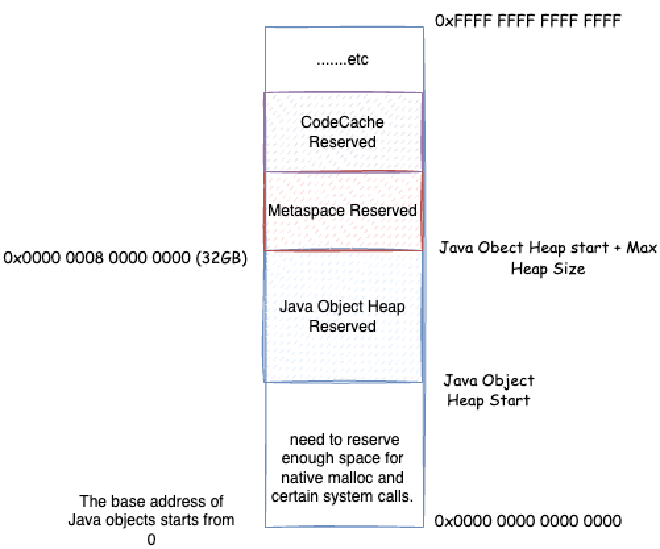
First, we consider removing the base address and object alignment offset, so compressed object pointers can be directly used as object addresses. When can this be done? That is when object addresses start from 0, and maximum heap memory + Java heap starting position is not greater than 4GB. Because in this case, the maximum address of objects in Java heap won’t exceed 4GB, so the range of compressed object pointers can directly represent all objects in Java heap. Compressed object pointers can be directly used as actual memory addresses for objects. Why is it maximum heap memory + Java heap starting position not greater than 4GB? Because from the previous analysis, we know that the space processes can apply for is native heap space. So, the Java heap starting position definitely won’t start from 0x0000 0000 0000 0000.

If maximum heap memory + Java heap starting position is greater than 4GB, the first optimization can’t be used, and object address offset can’t be avoided. But if we can ensure maximum heap memory + Java heap starting position is less than 32-bit * ObjectAlignmentInBytes, in the default case of ObjectAlignmentInBytes=8, which is 32GB, we can still make the base address equal to 0, so 64-bit address = (compressed object pointer << object alignment offset)
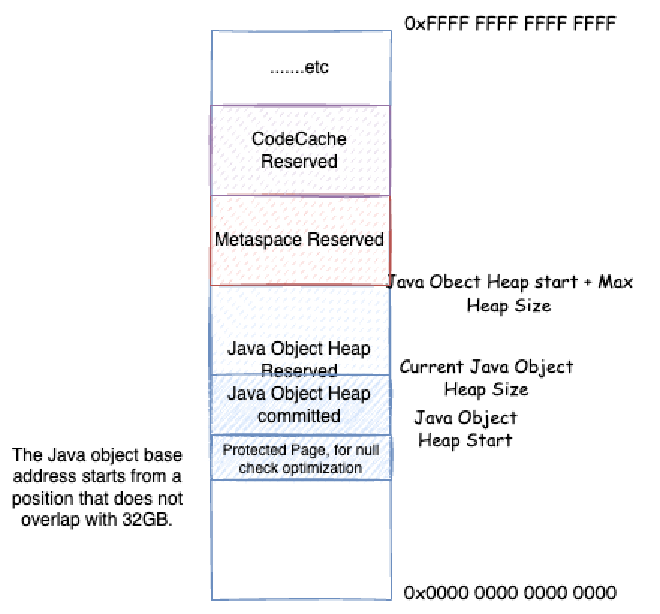
However, in the case of ObjectAlignmentInBytes=8, if maximum heap memory is too large, approaching 32GB, to ensure maximum heap memory + Java heap starting position is less than 32GB, the Java heap starting position would be close to 0, which obviously won’t work. So when maximum heap memory approaches 32GB, the second optimization above also becomes ineffective. But we can make Java heap start from an address completely disjoint from 32GB addresses, so addition can be optimized to bitwise OR operation, i.e., 64-bit address = base address | (compressed object pointer << object alignment offset)
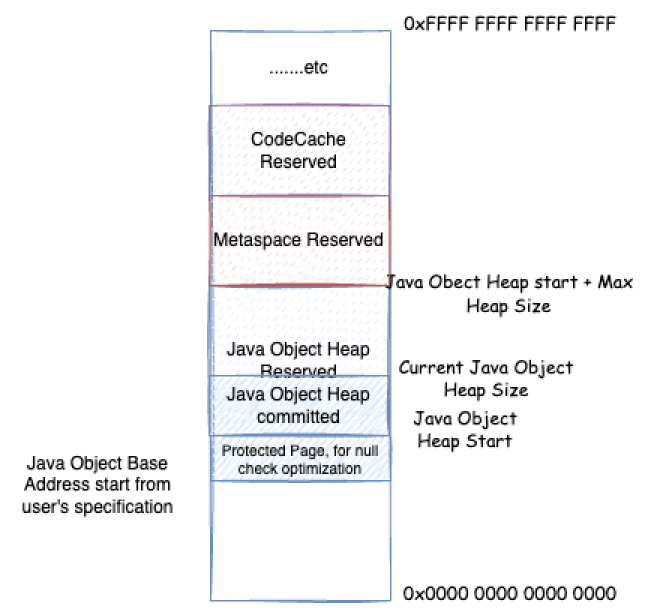
Finally, in the case of ObjectAlignmentInBytes=8, if users specify the Java heap starting address themselves through HeapBaseMinAddress, and it intersects with 32GB addresses, and maximum heap memory + Java heap starting position is greater than 32GB, but maximum heap memory doesn’t exceed 32GB, then it can’t be optimized, and can only use 64-bit address = base address + (compressed object pointer << object alignment offset)
To summarize, the four modes we discussed above correspond to four modes of compressed object pointers in JVM (the following description is based on ObjectAlignmentInBytes=8, i.e., the default case):
32-bitcompressed pointer mode: Maximum heap memory + Java heap starting position not greater than 4GB (and Java heap starting position can’t be too small),64-bit address = compressed object pointerZero basedcompressed pointer mode: Maximum heap memory + Java heap starting position not greater than 32GB (and Java heap starting position can’t be too small),64-bit address = (compressed object pointer << object alignment offset)Non-zero disjointcompressed pointer mode: Maximum heap memory not greater than 32GB, due to ensuring Java heap starting position can’t be too small, maximum heap memory + Java heap starting position greater than 32GB,64-bit address = base address | (compressed object pointer << object alignment offset)Non-zero basedcompressed pointer mode: Users specify Java heap starting address themselves throughHeapBaseMinAddress, and it intersects with 32GB addresses, and maximum heap memory + Java heap starting position greater than 32GB, but maximum heap memory doesn’t exceed 32GB,64-bit address = base address + (compressed object pointer << object alignment offset)
3.5. Why Reserve Page 0, Implementation of Compressed Object Pointer Null Check Elimination#
We learned earlier that compressed object pointers in JVM have four modes. For the two modes where addresses don’t start from 0, i.e., Non-zero disjoint and Non-zero based, the actual heap address doesn’t start from HeapBaseMinAddress, but has one page reserved, called page 0. This page doesn’t map actual memory, accessing addresses within this page will cause Segment Fault exceptions. So why reserve this page? Mainly for null check optimization, implementing null check elimination.
We all know that in Java, if you access member fields or methods of a null reference variable, it will throw NullPointerException. But how is this implemented? Our code doesn’t have explicit null checks that throw NullPointerException if null, but JVM can still throw this Java exception for null. We can guess that JVM might do such a check when accessing each reference variable for member fields or methods:
if (o == null) {
    throw new NullPointerException();
}
However, if such a check is done every time each reference variable is accessed for member fields or methods, it’s very inefficient behavior. So, during interpretation execution, such checks might be done every time each reference variable is accessed for member fields or methods. After code runs a certain number of times and enters C1, C2 compilation optimization, these null checks might be eliminated. Possible eliminations include:
- Member method access to this can eliminate null checks for this.
- Code explicitly checks whether a variable is null, and this variable is not volatile
- There was already
a.something()type access earlier, andais not volatile, then latera.somethingElse()doesn’t need null checks anymore - And so on…
For those that can’t be eliminated, JVM tends to make an assumption, i.e., this variable probably won’t be null, JIT optimization first directly eliminates null checks. Java’s null corresponds to compressed object pointer value 0:
enum class narrowOop : uint32_t { null = 0 };
Accessing compressed object pointer address 0 actually means accessing the compressed object pointer base address we discussed earlier. In the four modes:
32-bitcompressed pointer mode: Accessing0x0000 0000 0000 0000, but we know earlier that0x0000 0000 0000 0000is a reserved area that can’t be accessed, will haveSegment Faulterror, sendingSIGSEGVsignalZero basedcompressed pointer mode: Accessing0x0000 0000 0000 0000, but we know earlier that0x0000 0000 0000 0000is a reserved area that can’t be accessed, will haveSegment Faulterror, sendingSIGSEGVsignalNon-zero disjointcompressed pointer mode: Accessing base address, but we know earlier that base address + JVM system page size is a reserved area that’s only Reserved but not committed, can’t be accessed, will haveSegment Faulterror, sendingSIGSEGVsignalNon-zero basedcompressed pointer mode: Accessing base address, but we know earlier that base address + JVM system page size is a reserved area that’s only Reserved but not committed, can’t be accessed, will haveSegment Faulterror, sendingSIGSEGVsignal
For non-compressed object pointer cases, it’s simpler. Non-compressed object pointer null is 0x0000 0000 0000 0000, accessing 0x0000 0000 0000 0000, but we know earlier that 0x0000 0000 0000 0000 is a reserved area that can’t be accessed, will have Segment Fault error, sending SIGSEGV signal.
We can see that if JIT optimization eliminates null checks, then when actually encountering null, there will be Segment Fault error, sending SIGSEGV signal. JVM has handling for SIGSEGV signals:
//This is code under AMD64 CPU
} else if (
        //If signal is SIGSEGV
        sig == SIGSEGV &&
        //And it's SIGSEGV caused by encountering null where null checks were eliminated (we'll see many other places use SIGSEGV later)
        MacroAssembler::uses_implicit_null_check(info->si_addr)
        ) {
  // If it's SIGSEGV caused by encountering null, then we need to evaluate whether to continue eliminating null checks here
  stub = SharedRuntime::continuation_for_implicit_exception(thread, pc, SharedRuntime::IMPLICIT_NULL);
}
JVM not only uses SIGSEGV signals for null check elimination, but also uses them in other places (such as the StackOverflowError implementation we’ll analyze in detail later). So, we need to judge by checking the address where the SIGSEGV signal occurred. If the address is in the ranges we listed above, then it’s SIGSEGV caused by encountering null where null checks were eliminated:
bool MacroAssembler::uses_implicit_null_check(void* address) {
  uintptr_t addr = reinterpret_cast<uintptr_t>(address);
  uintptr_t page_size = (uintptr_t)os::vm_page_size();
#ifdef _LP64
  //If compressed object pointers are enabled
  if (UseCompressedOops && CompressedOops::base() != NULL) {
    //If there's a reserved page (page 0), start point is base address
    uintptr_t start = (uintptr_t)CompressedOops::base();
    //If there's a reserved page (page 0), end point is base address + page size
    uintptr_t end = start + page_size;
    //If address range is in page 0, then it's SIGSEGV caused by encountering null where null checks were eliminated
    if (addr >= start && addr < end) {
      return true;
    }
  }
#endif
  //If in page 0 of the entire virtual space, then it's SIGSEGV caused by encountering null where null checks were eliminated
  return addr < page_size;
}
Let’s substitute the 4 cases of compressed object pointers:
32-bitcompressed pointer mode: Accessing0x0000 0000 0000 0000, address is in page 0,uses_implicit_null_checkreturns trueZero basedcompressed pointer mode: Accessing0x0000 0000 0000 0000, address is in page 0,uses_implicit_null_checkreturns trueNon-zero disjointcompressed pointer mode: Accessing base address, address is in page 0,uses_implicit_null_checkreturns trueNon-zero basedcompressed pointer mode: Accessing base address, address is in page 0,uses_implicit_null_checkreturns true
For non-compressed object pointer cases, it’s simpler. Non-compressed object pointer null is 0x0000 0000 0000 0000, accessing base address, address is in page 0, uses_implicit_null_check returns true.
This way, we know that JIT might eliminate null checks, throwing NullPointerException through SIGSEGV signals. However, going through SIGSEGV signals requires system calls, and system calls are very inefficient behavior that we need to avoid as much as possible. But the assumption here is that it’s probably not null, so using system calls doesn’t matter. But if a place frequently has null, JIT will consider not optimizing this way, deoptimizing the code and recompiling, no longer eliminating null checks but using explicit null checks to throw.
Finally, we know that reserving page 0 and not mapping memory is actually to make accessing base address trigger Segment Fault. JVM will catch this signal, check whether the memory address that triggered this signal belongs to the first page, and if it does, JVM knows this is caused by a null object. However, from the above, we actually only need to not map the address corresponding to the base address, so why reserve an entire page? This is due to considerations of memory alignment and addressing access speed. Memory mapping to physical memory is all done in page units, so memory needs to be page-aligned.
3.6. Relationship Between Compressed OOPs and Heap Memory Initialization#
In the previous sections, we explained how the three key metrics (MinHeapSize, MaxHeapSize, InitialHeapSize) are calculated when not manually specified, but we didn’t cover compressed object pointers. When compressed object pointers are enabled, after heap memory limits are initialized, the system determines whether compressed object pointers should be enabled based on the parameters:
- First, determine the Java heap starting position:
- Step 1: In different operating systems and CPU environments, the default value of
HeapBaseMinAddressvaries. In most environments, it’s2GB. For example, in Linux x86 environments, checking the source code: https://github.com/openjdk/jdk/blob/jdk-21%2B3/src/hotspot/os_cpu/linux_x86/globals_linux_x86.hpp:define_pd_global(size_t, HeapBaseMinAddress, 2*G); - Set
DefaultHeapBaseMinAddressto the default value ofHeapBaseMinAddress, which is2GB - If the user specifies
HeapBaseMinAddressin startup parameters and it’s less thanDefaultHeapBaseMinAddress, setHeapBaseMinAddresstoDefaultHeapBaseMinAddress - Calculate the maximum heap size for compressed object pointer heap:
- Read the object alignment size parameter
ObjectAlignmentInBytes, default is 8 - Take the base-2 logarithm of
ObjectAlignmentInBytes, recorded asLogMinObjAlignmentInBytes - Left-shift 32 bits by
LogMinObjAlignmentInBytesto getOopEncodingHeapMax, which is the maximum heap size without considering reserved areas - If a reserved area is needed (in
Non-Zero Based DisjointandNon-Zero Basedmodes), subtract the reserved area (page 0 size) fromOopEncodingHeapMax - Read the current JVM’s configured maximum heap size (we analyzed how this is calculated earlier)
- If the JVM’s configured maximum heap is smaller than the compressed object pointer heap’s maximum heap size, and compressed object pointers aren’t explicitly disabled via JVM startup parameters, enable compressed object pointers. Otherwise, disable them.
- If compressed object pointers are disabled, and compressed class pointers strongly depend on compressed object pointers (as analyzed earlier), disable compressed class pointers as well
3.7. Using jol + jhsdb + JVM Logs to Verify Compressed Object Pointers and Java Heap#
Add the jol dependency:
<dependency>
    <groupId>org.openjdk.jol</groupId>
    <artifactId>jol-core</artifactId>
    <version>0.16</version>
</dependency>
Write the code:
package test;

import org.openjdk.jol.info.ClassLayout;

public class TestClass {
    // TestClass object contains only one field: next
    private String next = new String();

    public static void main(String[] args) throws InterruptedException {
        // Create a local variable tt on the stack, pointing to a TestClass object created on the heap
        final TestClass tt = new TestClass();
        // Use jol to output the structure of the object pointed to by tt
        System.out.println(ClassLayout.parseInstance(tt).toPrintable());
        // Wait indefinitely to prevent program exit
        Thread.currentThread().join();
    }
}
3.7.1. Verifying 32-bit Compressed Pointer Mode#
Let’s first test the first compressed object pointer mode (32-bit), where the Java heap is located between 0x0000 0000 0000 0000 ~ 0x0000 0001 0000 0000 (0~4GB). Use the following startup parameters:
-Xmx32M -Xlog:coops*=debug
Where -Xlog:coops*=debug displays JVM logs with coops tags at debug level. This log shows the heap’s starting virtual memory location, reserved heap space size, and compressed object pointer mode.
After startup, check the log output:
[0.006s][debug][gc,heap,coops] Heap address: 0x00000000fe000000, size: 32 MB, Compressed Oops mode: 32-bit
test.TestClass object internals:
OFF  SZ               TYPE DESCRIPTION               VALUE
  0   8                    (object header: mark)     0x0000000000000001 (non-biasable; age: 0)
  8   4                    (object header: class)    0x00c01000
 12   4   java.lang.String TestClass.next            (object)
Instance size: 16 bytes
Space losses: 0 bytes internal + 0 bytes external = 0 bytes total
The first log line tells us the heap starts at 0x0000 0000 fe00 0000, size is 32 MB, and compressed object pointer mode is 32-bit. Adding 32 MB to 0x0000 0000 fe00 0000 equals 4GB 0x0000 0001 0000 0000. This confirms our earlier conclusion that the Java heap reserves space starting from the boundary minus the maximum heap size. In this case, 0x0000 0000 0000 0000 ~ 0x0000 0000 fdff ffff memory is used for process system calls and native memory allocation.
The subsequent logs show jol’s object structure output. We can see this object contains a markword (0x0000000000000001), a compressed class pointer (0x00c01000), and the next field. Let’s use jhsdb to examine the process’s actual virtual memory content for verification.
First, open jhsdb in GUI mode: jhsdb hsdb
Then “File” -> “Attach to Hotspot Process”, enter your JVM process ID: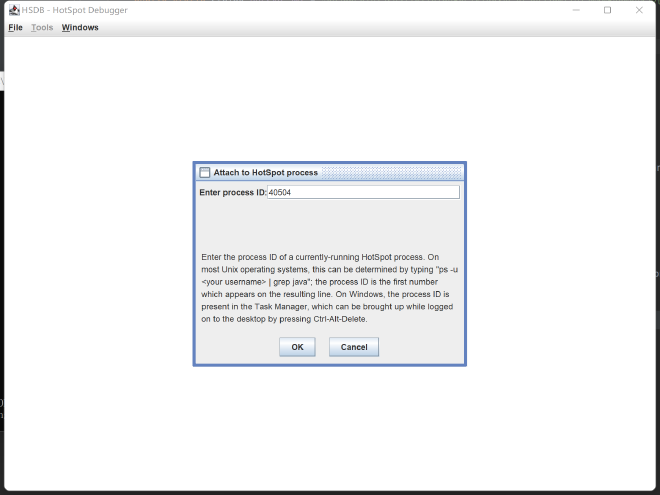
After successful attachment, you can see all threads of your JVM process in the panel. We’ll focus on the main thread. Click on the main thread, then click the red-boxed button (view thread stack memory):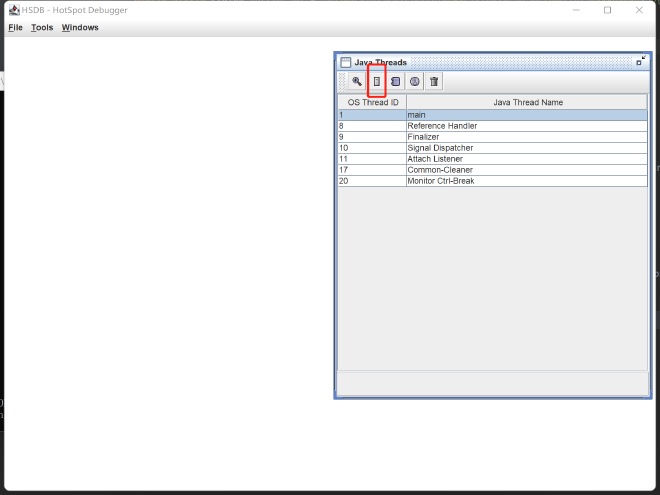
In the main thread stack memory, we can find the local variable tt from our code:
Here we can see the value stored in variable tt, which is actually the object’s address. Open “Tools” -> “Memory Viewer” to examine process virtual memory, and “Tools” -> “Inspector” to convert addresses to corresponding JVM C++ objects. Enter the local variable tt’s value seen in the main thread stack memory into both windows: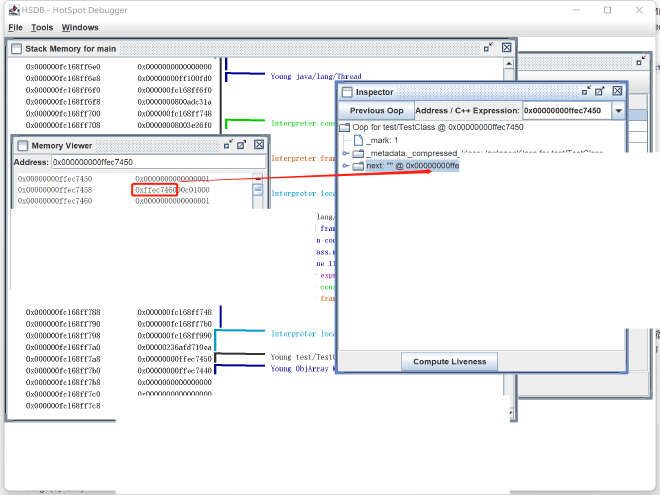
From the image above, we can see the object saved by tt starts at address 0x00000000ffec7450. The object header is 0x0000 0000 ffec 7450 ~ 0x0000 0000 ffec 7457, storing value 0x0000 0000 0000 0001, identical to jol’s output. The compressed class pointer is 0x0000 0000 ffec 7458 ~ 0x0000 0000 ffec 745b, storing value 0x00c0 1000, identical to jol’s compressed class pointer address. Next is the next field value, ranging 0x0000 0000 ffec 745c ~ 0x0000 0000 ffec 745f, storing value 0xffec 7460, with the corresponding string object’s actual address also being 0x0000 0000 ffec 7460. This perfectly matches the characteristics of 32-bit mode compressed class pointers we described earlier.
3.7.2. Verifying Zero based Compressed Pointer Mode#
Next, let’s try Zero based mode using parameters -Xmx2050M -Xlog:coops*=debug (platform-dependent; check your platform’s default HeapBaseMinAddress size, typically 2G for x86, so specify a value greater than 4G - 2G = 2G). The log output is:
[0.006s][debug][gc,heap,coops] Heap address: 0x000000077fe00000, size: 2050 MB, Compressed Oops mode: Zero based, Oop shift amount: 3
test.TestClass object internals:
OFF  SZ               TYPE DESCRIPTION               VALUE
  0   8                    (object header: mark)     0x0000000000000009 (non-biasable; age: 1)
  8   4                    (object header: class)    0x00c01000
 12   4   java.lang.String TestClass.next            (object)
Instance size: 16 bytes
Space losses: 0 bytes internal + 0 bytes external = 0 bytes total
This time, the Java heap starts at 0x0000 0007 7fe0 0000. Adding 2050 MB to 0x0000 0007 7fe0 0000 equals exactly 32GB, confirming our earlier conclusion about heap reservation starting from boundary minus maximum heap size.
The subsequent logs show jol’s object structure output. The object contains a markword (0x0000000000000009 - different from the previous example due to GC occurring before jol output), a compressed class pointer (0x00c01000), and the next field.
Let’s use jhsdb to examine the process’s actual virtual memory content, following the same steps as the previous example: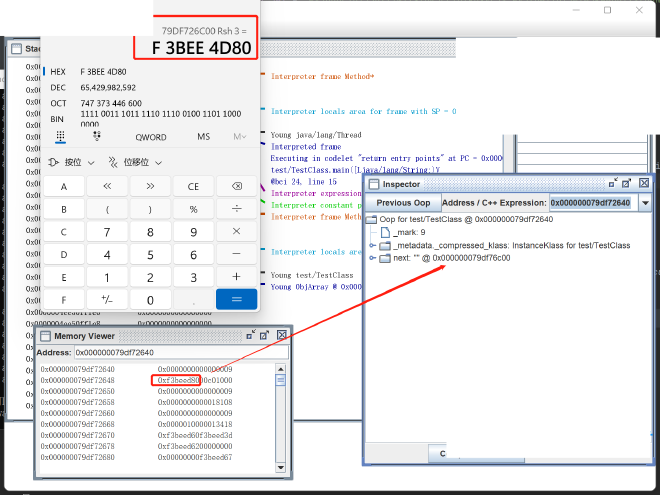
As shown above, the object saved by tt starts at 0x0000 0007 9df7 2640. We find the next field storing value 0xf3be ed80. Left-shifting this by three bits gives 0x0000 0007 9df7 6c00 (the inspector shows the decompressed object address, while Memory Viewer shows the actual value stored in virtual memory).
Let’s try making the first example use Zero based mode through HeapBaseMinAddress. Using startup parameters -Xmx32M -Xlog:coops*=debug -XX:HeapBaseMinAddress=4064M, where 4064MB + 32MB = 4GB, the log still shows 32-bit mode: [0.005s][debug][gc,heap,coops] Heap address: 0x00000000fe000000, size: 32 MB, Compressed Oops mode: 32-bit. Here 0x00000000fe000000 equals 4064MB, matching our startup parameter configuration. Using startup parameters -Xmx32M -Xlog:coops*=debug -XX:HeapBaseMinAddress=4065M, we see:
[0.005s][debug][gc,heap,coops] Heap address: 0x00000000fe200000, size: 32 MB, Compressed Oops mode: Zero based, Oop shift amount: 3
test.TestClass object internals:
OFF  SZ               TYPE DESCRIPTION               VALUE
  0   8                    (object header: mark)     0x0000000000000001 (non-biasable; age: 0)
  8   4                    (object header: class)    0x00c01000
 12   4   java.lang.String TestClass.next            (object)
Instance size: 16 bytes
Space losses: 0 bytes internal + 0 bytes external = 0 bytes total
The mode changes to Zero based, with heap starting at 0x00000000fe200000 (4066MB), which doesn’t match our startup parameter due to alignment strategies related to the GC being used. We’ll analyze this when discussing GC in future articles.
3.7.3. Verifying Non-zero disjoint Compressed Pointer Mode#
Next, let’s examine the Non-zero disjoint mode using parameters -Xmx31G -Xlog:coops*=debug. The log output is:
[0.007s][debug][gc,heap,coops] Protected page at the reserved heap base: 0x0000001000000000 / 16777216 bytes
[0.007s][debug][gc,heap,coops] Heap address: 0x0000001001000000, size: 31744 MB, Compressed Oops mode: Non-zero disjoint base: 0x0000001000000000, Oop shift amount: 3
test.TestClass object internals:
OFF  SZ               TYPE DESCRIPTION               VALUE
  0   8                    (object header: mark)     0x0000000000000001 (non-biasable; age: 0)
  8   4                    (object header: class)    0x00c01000
 12   4   java.lang.String TestClass.next            (object)
Instance size: 16 bytes
Space losses: 0 bytes internal + 0 bytes external = 0 bytes total
We can see the protected page size is 16MB (16777216 bytes), and the actual Java heap starts at 0x0000 0010 0100 0000. The base address is no longer 0 (Non-zero disjoint base: 0x0000001000000000), completely disjoint from 32GB addresses, allowing addition to be optimized to OR operations. The jol output shows the object contains a markword (0x0000000000000001), a compressed class pointer (0x00c01000), and the next field.
Let’s use jhsdb to examine the process’s actual virtual memory content, following the same steps as previous examples: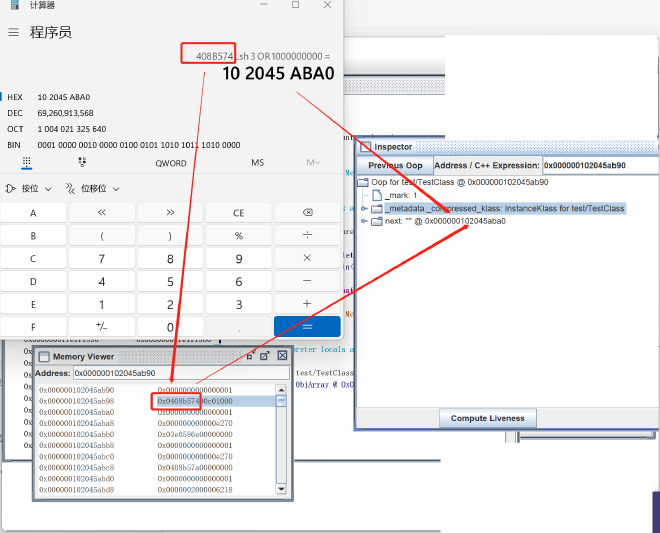
As shown above, the object saved by tt starts at 0x000000102045ab90. We find the next field storing value 0x0408 b574. Left-shifting this by three bits gives 0x0000 0000 2045 aba0 (inspector shows the decompressed object address, Memory Viewer shows the actual virtual memory value), then ORing with the base address 0x0000 0010 0000 0000 gives the actual address of the string object pointed to by next: 0x0000 0010 2045 aba0, which matches the inspector’s next parsing result.
3.7.4. Verifying Non-zero based Compressed Pointer Mode#
Finally, let’s examine the last mode, Non-zero based, using parameters -Xmx31G -Xlog:coops*=debug -XX:HeapBaseMinAddress=2G. The log output is:
[0.005s][debug][gc,heap,coops] Protected page at the reserved heap base: 0x0000000080000000 / 16777216 bytes
[0.005s][debug][gc,heap,coops] Heap address: 0x0000000081000000, size: 31744 MB, Compressed Oops mode: Non-zero based: 0x0000000080000000, Oop shift amount: 3
test.TestClass object internals:
OFF  SZ               TYPE DESCRIPTION               VALUE
  0   8                    (object header: mark)     0x0000000000000001 (non-biasable; age: 0)
  8   4                    (object header: class)    0x00c01000
 12   4   java.lang.String TestClass.next            (object)
Instance size: 16 bytes
Space losses: 0 bytes internal + 0 bytes external = 0 bytes total
We can see the protected page size is 16MB (16777216 bytes), and the actual Java heap starts at 0x0000 0000 8100 0000. The base address is no longer 0 (Non-zero based: 0x0000000080000000). The jol output shows the object contains a markword (0x0000000000000001), a compressed class pointer (0x00c01000), and the next field.
Let’s use jhsdb to examine the process’s actual virtual memory content, following the same steps as previous examples: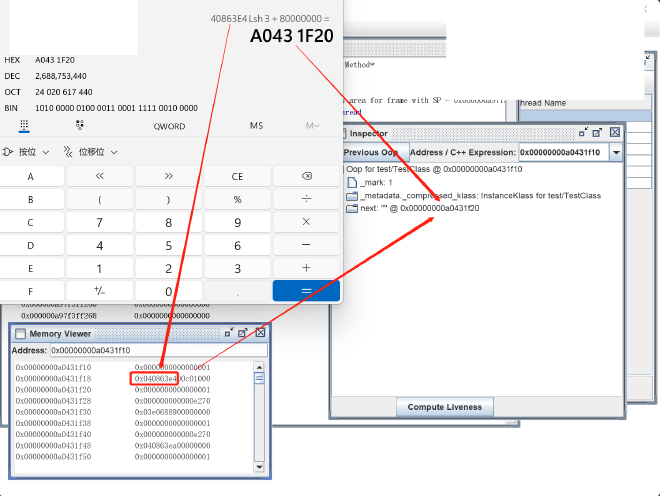
As shown above, the object saved by tt starts at 0x00000000a0431f10. We find the next field storing value 0x0408 63e4. Left-shifting this by three bits gives 0x0000 0000 2043 1f20 (inspector shows the decompressed object address, Memory Viewer shows the actual virtual memory value), then adding the base address 0x0000 0000 8000 0000 (which is 2GB, as specified in -XX:HeapBaseMinAddress=2G) gives the actual address of the string object pointed to by next: 0x0000 0000 a043 1f20, which matches the inspector’s next parsing result.
3.8. Dynamic Heap Size Adjustment#
Different GCs have vastly different approaches to dynamic heap size adjustment (for example, ParallelGC involves UseAdaptiveSizePolicy’s dynamic heap size strategy and related parameters like UsePSAdaptiveSurvivorSizePolicy, UseAdaptiveGenerationSizePolicyAtMinorCollection, etc., which participate in determining the calculation method and timing for new heap sizes). We’ll analyze these different GC dynamic adjustment strategies in detail when we examine each GC in future series chapters. Here we only cover the parameters involved in heap size adjustment that are common to most GCs: MinHeapFreeRatio and MaxHeapFreeRatio:
MinHeapFreeRatio: Target minimum heap free ratio. If the free ratio of a heap region (entire heap for some GCs) after a GC is below this ratio, expansion is considered. Default is 40 (40%), but some GCs default to 0% if not set. 0% means never expand due to not meeting the target minimum heap free ratio, typically configured for heap size stability.MaxHeapFreeRatio: Target maximum heap free ratio. If the free ratio of a heap region (entire heap for some GCs) after a GC exceeds this ratio, shrinking is considered. Default is 70 (70%), but some GCs default to 100% if not set. 100% means never shrink due to not meeting the target maximum heap free ratio, typically configured for heap size stability.MinHeapDeltaBytes: Minimum memory expansion when expanding. Default is 166.4 KB (128*13/10)
The corresponding source code is: https://github.com/openjdk/jdk/blob/jdk-21%2B3/src/hotspot/share/runtime/globals.hpp:
product(uintx, MinHeapFreeRatio, 40, MANAGEABLE,                    \
  "The minimum percentage of heap free after GC to avoid expansion."\
  " For most GCs this applies to the old generation. In G1 and"     \
  " ParallelGC it applies to the whole heap.")                      \
  range(0, 100)                                                     \
  constraint(MinHeapFreeRatioConstraintFunc,AfterErgo)              \
product(uintx, MaxHeapFreeRatio, 70, MANAGEABLE,                    \
  "The maximum percentage of heap free after GC to avoid shrinking."\
  " For most GCs this applies to the old generation. In G1 and"     \
  " ParallelGC it applies to the whole heap.")                      \
  range(0, 100)                                                     \
  constraint(MaxHeapFreeRatioConstraintFunc,AfterErgo)              \
product(size_t, MinHeapDeltaBytes, ScaleForWordSize(128*K),         \
  "The minimum change in heap space due to GC (in bytes)")          \
  range(0, max_uintx)                                               \
The actual behavior of these two parameters under different GCs is as follows:
SerialGC: For SerialGC,
MinHeapFreeRatioandMaxHeapFreeRatiorefer only to the old generation’s target free ratio, affecting only the old generation. When GC involving the old generation (essentially FullGC) is triggered, after GC completion, the current old generation’s free ratio is checked and compared withMinHeapFreeRatioandMaxHeapFreeRatioto determine whether to expand or shrink the old generation size (source code reference:https://github.com/openjdk/jdk/blob/jdk-21%2B3/src/hotspot/share/gc/serial/tenuredGeneration.cpp).ParallelGC: For ParallelGC,
MinHeapFreeRatioandMaxHeapFreeRatiorefer to the entire heap size. Additionally, if these JVM parameters aren’t explicitly specified,MinHeapFreeRatiobecomes 0 andMaxHeapFreeRatiobecomes 100 (source code reference:https://github.com/openjdk/jdk/blob/jdk-21%2B3/src/hotspot/share/gc/parallel/parallelArguments.cpp), effectively not adjusting heap size based on these parameters. Also, ifUseAdaptiveSizePolicyis false, these parameters won’t take effect.G1GC: For G1GC,
MinHeapFreeRatioandMaxHeapFreeRatiorefer to the entire heap size. When GC involving the old generation is triggered, after GC completion, the current heap’s free ratio is checked and compared withMinHeapFreeRatioandMaxHeapFreeRatioto determine whether to expand or shrink the heap by increasing or decreasing the number of Regions (source code reference:https://github.com/openjdk/jdk/blob/jdk-21%2B3/src/hotspot/share/gc/g1/g1HeapSizingPolicy.cpp).ShenandoahGC: These three parameters don’t take effect
ZGC: These three parameters don’t take effect
3.9. JVM Parameter AggressiveHeap for Long-Running Applications Using All Available Memory#
AggressiveHeap is an aggressive configuration that lets the JVM use the current system’s remaining memory. When enabled, it automatically sets heap size and other memory parameters based on available system memory, allocating half the memory to the heap and leaving the other half for off-heap subsystems. It achieves this by forcing the use of ParallelGC, a GC algorithm that doesn’t consume too much off-heap memory (you can only use this GC; specifying other GCs will cause startup errors: Error occurred during initialization of VM. Multiple garbage collectors selected). Default is false (disabled), can be enabled with -XX:+AggressiveHeap.
When enabled, it first checks if system memory is sufficient (at least 256 MB); if not, it reports an error. If sufficient, it calculates a target heap size:
Target heap size = Math.min(Available system memory/2, Available system memory - 160MB)
After that, enabling this parameter forces the following settings:
MaxHeapSize: Maximum heap memory set to target heap sizeInitialHeapSize: Initial heap memory set to target heap sizeNewSizeandMaxNewSize: Young generation set to target heap size * 3/8BaseFootPrintEstimate: Off-heap memory usage estimate set to target heap size, used to guide initialization of some off-heap memory structuresUseLargePages: Enabled, uses large page memory allocation to increase actual physical memory continuityTLABSize: Set to 256K, initial TLAB size is 256K, but since we setResizeTLABto false below, TLAB will remain at 256KResizeTLAB: Set to false, so TLAB size no longer changes with GC and allocation characteristics, reducing unnecessary calculations. Since the process will exist long-term, specify a relatively large TLAB value at initialization. For TLAB details, please refer to the first part of this series: The Most Hardcore JVM TLAB AnalysisUseParallelGC: Set to true, forces use of ParallelGCThresholdTolerance: Set to maximum value 100.ThresholdToleranceis used to dynamically control the number of GC cycles objects need to survive before promotion to old generation. If1 + ThresholdTolerance/100* MinorGC time is greater than MajorGC time, we consider MinorGC takes too much proportion and need to promote more objects to old generation. Conversely, if1 + ThresholdTolerance/100* MajorGC time is greater than MinorGC time, we consider MajorGC takes too much time and need to promote fewer objects to old generation. Setting it to 100 keeps this promotion threshold basically unchanged and stable.ScavengeBeforeFullGC: Set to false, attempts a YoungGC before FullGC. For long-running applications that frequently perform YoungGC and promote objects, when FullGC is needed, YoungGC usually can’t reclaim enough memory to avoid FullGC. Disabling it helps avoid ineffective scanning that dirties CPU cache.
3.10. The Role of JVM Parameter AlwaysPreTouch#
In Chapter 2’s analysis, we learned about JVM’s memory allocation process. Memory isn’t immediately allocated actual physical memory by the operating system after JVM commits a block of memory; physical memory is only associated when data is actually written to it. So for JVM heap memory, we can also infer that heap memory is associated with actual physical memory as objects are allocated. Is there a way to force committed memory to be associated with actual physical memory in advance? It’s simple: write dummy data to this committed memory (usually filled with 0s).
For different GCs, due to different heap memory designs, handling of AlwaysPreTouch also varies slightly. In future series when we analyze each GC in detail, we’ll thoroughly examine each GC’s heap memory design. Here we’ll simply list the common AlwaysPreTouch handling. When AlwaysPreTouch is enabled, all newly committed heap memory is filled with 0s, equivalent to writing empty data to make committed memory truly allocated.
Different operating system environments implement filling with 0s differently, but the basic approach is atomically adding 0 to memory addresses: https://github.com/openjdk/jdk/blob/jdk-21%2B3/src/hotspot/share/runtime/os.cpp:
void os::pretouch_memory(void* start, void* end, size_t page_size) {
  if (start < end) {
    // Align start and end
    char* cur = static_cast<char*>(align_down(start, page_size));
    void* last = align_down(static_cast<char*>(end) - 1, page_size);
    // Write empty data to memory through Atomic::add
    for ( ; true; cur += page_size) {
      Atomic::add(reinterpret_cast<int*>(cur), 0, memory_order_relaxed);
      if (cur >= last) break;
    }
  }
}
In Linux x86 environments, Atomic::add is implemented using xaddq with lock instruction: https://github.com/openjdk/jdk/blob/jdk-21%2B3/src/hotspot/os_cpu/linux_x86/atomic_linux_x86.hpp:
template<>
template<typename D, typename I>
inline D Atomic::PlatformAdd<8>::fetch_and_add(D volatile* dest, I add_value,
                                               atomic_memory_order order) const {
  STATIC_ASSERT(8 == sizeof(I));
  STATIC_ASSERT(8 == sizeof(D));
  D old_value;
  __asm__ __volatile__ ("lock xaddq %0,(%2)"
                        : "=r" (old_value)
                        : "0" (add_value), "r" (dest)
                        : "cc", "memory");
  return old_value;
}
Also, if we only process these Atomic::add operations serially, it would be extremely slow. We can divide the memory to be preTouched into non-overlapping regions, then concurrently fill these non-overlapping memory regions. The latest versions of Java have implemented concurrent PreTouch in various concurrent GCs, but historically different GCs have had different issues with AlwaysPreTouch. Here’s a summary:
ParallelGC:
- Starting from Java 16 build 21, ParallelGC implemented concurrent PreTouch:
G1GC:
- Before Java 9 build 45, AlwaysPreTouch didn’t work for G1GC, this was a bug:
- Starting from Java 9 build 139, G1GC implemented concurrent PreTouch:
ZGC:
- Starting from Java 14 build 26, ZGC implemented concurrent PreTouch:
3.11. JVM Parameter UseContainerSupport - How JVM Detects Container Memory Limits#
In previous sections, we analyzed JVM’s automatic heap size calculation, where the first step is JVM reading system memory information. In container environments, JVM can also detect the current container environment and read corresponding memory limits. The JVM parameter that enables JVM to detect container environments is UseContainerSupport, with a default value of true, meaning JVM detects container configuration. Related source code: https://github.com/openjdk/jdk/blob/jdk-21+3/src/hotspot/os/linux/globals_linux.hpp:
product(bool, UseContainerSupport, true,                          \
  "Enable detection and runtime container configuration support") \
This configuration is enabled by default. When enabled, JVM reads memory limits through the following process:
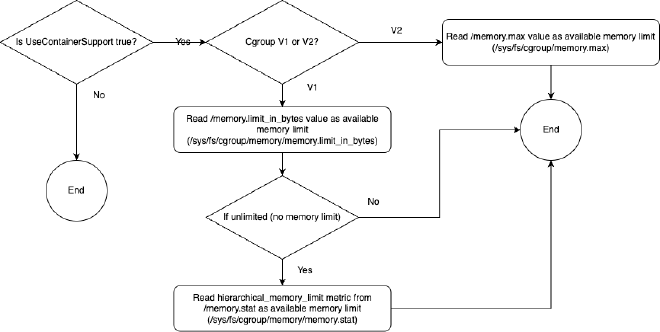
As we can see, it considers Cgroup V1 and V2 scenarios, as well as cases where pod Memory limits are not restricted.
3.12. SoftMaxHeapSize - For Smooth Migration to More Memory-Intensive GCs#
Since fully concurrent GCs (targeting completely Stop-the-World-free or sub-millisecond pause GCs), such as ZGC, require much more off-heap space than G1GC and ParallelGC (referring to the GC portion memory usage we’ll analyze in Native Memory Tracking later), and because ZGC is currently non-generational (generational ZGC will be introduced after Java 20), GC occupies even more off-heap memory. So we generally believe that when switching from G1GC or ParallelGC to ZGC, even if maximum heap size and other JVM parameters remain unchanged, JVM will need more physical memory. However, in actual production, modifying JVM GC is relatively simple - just change startup parameters - but adding memory to JVM is more difficult because it consumes actual resources. If we don’t modify JVM memory limit parameters or add available memory, production systems might frequently get killed by OOMkiller after switching GCs.
To enable smoother GC switching, and because production applications may not actually need the originally configured heap size space, JVM introduced the SoftMaxHeapSize parameter for ShenandoahGC and ZGC (currently this parameter only works for these Stop-the-World-avoidance-focused GCs). Although this parameter defaults to 0, if not specified, it’s automatically set to the MaxHeapSize mentioned earlier. Reference source code:
https://github.com/openjdk/jdk/blob/jdk-21%2B3/src/hotspot/share/gc/shared/gc_globals.hpp
product(size_t, SoftMaxHeapSize, 0, MANAGEABLE,                     \
  "Soft limit for maximum heap size (in bytes)")                    \
  constraint(SoftMaxHeapSizeConstraintFunc,AfterMemoryInit)         \
https://github.com/openjdk/jdk/blob/jdk-21%2B3/src/hotspot/share/gc/shared/gcArguments.cpp
// If SoftMaxHeapSize is not set, automatically set it to MaxHeapSize mentioned earlier
if (FLAG_IS_DEFAULT(SoftMaxHeapSize)) {
    FLAG_SET_ERGO(SoftMaxHeapSize, MaxHeapSize);
}
Both ZGC and ShenandoahGC heap designs have the concept of soft maximum size limits. This soft maximum size continuously changes over time based on GC performance (such as allocation rate, free ratio, etc.). These two GCs try not to expand heap size after the heap extends to the soft maximum size, instead attempting to reclaim space through aggressive GC. Only when Stop-the-World cannot reclaim enough memory for allocation will they attempt to expand, with the ultimate limit being MaxHeapSize. SoftMaxHeapSize provides guidance for this soft maximum size, preventing it from exceeding this value.
4. JVM Metaspace Design#
4.1. What is Metadata and Why Do We Need Metadata#
When executing Java applications, JVM records many details of loaded Java classes in memory. This information is called class metadata (Class MetaData). This metadata is crucial for many flexible language and virtual machine features of Java, such as dynamic class loading, JIT real-time compilation, reflection, and dynamic proxies. Different JVMs store different memory information when loading classes, typically trading off between lower memory usage and faster execution speed (similar to space vs. time tradeoffs). OpenJDK Hotspot uses a relatively rich metadata model to achieve the fastest possible performance (prioritizing time, optimizing space usage when it doesn’t affect speed). Compared to C, C++, Go and other languages that compile offline to executable binary files, managed runtimes like JVM that dynamically interpret or compile and execute need to retain more runtime information about the executing code. The reasons are:
The set of dependent class libraries is not a fixed finite set: Java can dynamically load classes, and there are tools like ASM and Javassist that dynamically define and load classes at runtime, plus mechanisms like JVMTI agents that dynamically modify classes. Therefore, JVM uses class metadata to maintain: which classes exist at runtime, what methods and fields they contain, and the ability to dynamically resolve references from one class to another during linking and loading. Class linking also needs to consider class visibility and accessibility. Class metadata is associated with class loaders, and also includes class permissions, package paths, and module information (modularization introduced in Java 9) to determine accessibility.
JVM needs information based on class metadata when interpreting or JIT compiling Java code: It needs to know relationships between classes, class attributes, fields, method structures, etc. For example, when performing type casting, it needs to check parent-child class relationships to determine if casting is allowed.
JVM needs statistical data to decide which code to interpret and which hot code needs JIT compilation.
Java has reflection APIs for user use, requiring runtime knowledge of all class information.
4.2. When Metaspace is Used and What it Stores#
4.2.1. When Metaspace is Used and Release Timing#
Metaspace is used whenever class loading occurs. For example, when we create a class object: the class is first loaded by a class loader, and during class loading, the corresponding class metadata is stored in metaspace. Metadata is stored in metaspace in two parts: one part goes to metaspace’s class space, another part goes to metaspace’s non-class space. The Klass pointer in the object header of heap objects points to the Klass in metaspace. Meanwhile, various fields in Klass are pointers to actual object addresses, which may be in non-class space, such as vtables and itables that implement method polymorphism and virtual calls, storing method code address reference pointers. Non-class space stores larger metadata, such as constant pools, bytecode, JIT-compiled code, etc. Since compiled code can be very large, and JVM’s multi-language support extensions may dynamically load many classes, MetaSpace’s class space and non-class space are separated. As shown in the diagram:
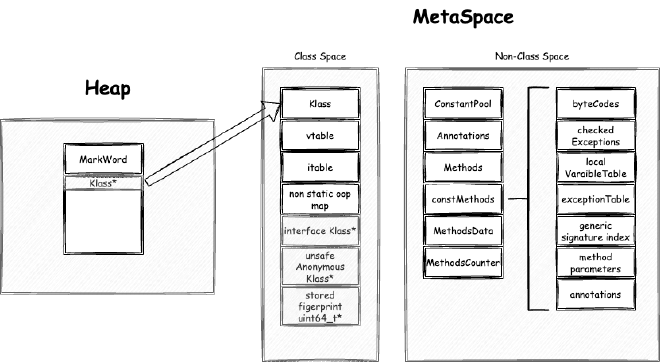
JVM startup parameter -XX:CompressedClassSpaceSize specifies compressed class space size, default is 1G. -XX:MaxMetaspaceSize controls total MetaSpace size. We’ll explain these and more MetaSpace parameters in detail in later sections.
When all classes loaded by a class loader have no instances, no references point to these class objects (java.lang.Class), and no references point to this class loader, if GC occurs, the metaspace used by this class loader will be released. However, this release doesn’t necessarily return memory to the operating system, but marks it as available for use by other class loaders.
4.2.2. What Metaspace Stores#
Metaspace stores data currently divided into two major categories:
Java class data: The Klass objects corresponding to loaded Java classes in JVM (Klass is a C++ class in JVM source code, you can think of it as the memory form of classes in JVM), but much of the data stored in these Klass objects are pointers, with specific data belonging to non-Java class data. Generally, non-Java class data occupies much more space than Java class data.
Non-Java class data: Data referenced by Klass objects, such as various methods in classes, annotations, execution collection and statistical information, etc.
If it’s a 64-bit JVM (from Java 9+ there are only 64-bit VMs) and compressed class pointers are enabled (-XX:+UseCompressedClassPointers, enabled by default), metaspace is divided into two parts:
- Class metaspace: Space storing the Java class data mentioned above
- Data metaspace: Space storing the non-Java class data mentioned above
The reason for dividing based on whether compressed class pointers are enabled is that object headers need to retain pointers to Klass. If we can compress this pointer size as much as possible, then each object’s size can also be compressed, saving a lot of heap space. On 64-bit virtual machines, pointers are 64-bit by default. After enabling compressed class pointers (-XX:+UseCompressedClassPointers, enabled by default), class pointers become 32-bit, pointing to at most 2^32 or 4G of space. If we can keep the space where Klass resides within this limit, we can use compressed class pointers. So we extract Klass into a separate region for allocation. Klass doesn’t occupy much space - although there’s one Klass for each Java class, the space-consuming method content and dynamic compilation information are stored in data metaspace, with Klass mostly containing pointers. It’s rare to encounter situations where 32-bit pointers aren’t sufficient.
Note that in older versions, UseCompressedClassPointers depended on UseCompressedOops - if compressed object pointers weren’t enabled, compressed class pointers couldn’t be enabled either. However, starting from Java 15 Build 23, UseCompressedClassPointers no longer depends on UseCompressedOops, and the two are independent in most cases, except when using JVM Compiler Interface (like GraalVM) on x86 CPUs. Reference JDK ISSUE: https://bugs.openjdk.java.net/browse/JDK-8241825 - Make compressed oops and compressed class pointers independent (x86_64, PPC, S390) and source code:
https://github.com/openjdk/jdk/blob/jdk-21%2B3/src/hotspot/cpu/x86/globalDefinitions_x86.hpp:#define COMPRESSED_CLASS_POINTERS_DEPENDS_ON_COMPRESSED_OOPS EnableJVMCIOn x86 CPUs, whetherUseCompressedClassPointersdepends onUseCompressedOopsdepends on whether JVMCI is enabled. In default JVM releases, EnableJVMCI is false.https://github.com/openjdk/jdk/blob/jdk-21%2B3/src/hotspot/cpu/arm/globalDefinitions_arm.hpp:#define COMPRESSED_CLASS_POINTERS_DEPENDS_ON_COMPRESSED_OOPS falseOn ARM CPUs,UseCompressedClassPointersdoesn’t depend onUseCompressedOopshttps://github.com/openjdk/jdk/blob/jdk-21%2B3/src/hotspot/cpu/ppc/globalDefinitions_ppc.hpp:#define COMPRESSED_CLASS_POINTERS_DEPENDS_ON_COMPRESSED_OOPS falseOn PPC CPUs,UseCompressedClassPointersdoesn’t depend onUseCompressedOopshttps://github.com/openjdk/jdk/blob/jdk-21%2B3/src/hotspot/cpu/s390/globalDefinitions_s390.hpp:#define COMPRESSED_CLASS_POINTERS_DEPENDS_ON_COMPRESSED_OOPS falseOn S390 CPUs,UseCompressedClassPointersdoesn’t depend onUseCompressedOops
Objects allocated in metaspace all call Metaspace::allocate to allocate space from metaspace. This method is called by MetaspaceObj’s constructor. Corresponding source code: https://github.com/openjdk/jdk/blob/jdk-21+3/src/hotspot/share/memory/allocation.cpp
void* MetaspaceObj::operator new(size_t size, ClassLoaderData* loader_data,
                                 size_t word_size,
                                 MetaspaceObj::Type type, TRAPS) throw() {
  // Klass has its own operator new
  return Metaspace::allocate(loader_data, word_size, type, THREAD);
}

void* MetaspaceObj::operator new(size_t size, ClassLoaderData* loader_data,
                                 size_t word_size,
                                 MetaspaceObj::Type type) throw() {
  assert(!Thread::current()->is_Java_thread(), "only allowed by non-Java thread");
  return Metaspace::allocate(loader_data, word_size, type);
}
MetaspaceObj’s operator new method defines memory allocation from MetaSpace, meaning all MetaspaceObj subclasses, unless explicitly overriding to allocate from elsewhere, will allocate memory from MetaSpace. MetaspaceObj subclasses include:
Located in class metaspace:
Klass: The Java class instance (each Java class has a corresponding object instance used for reflection access, this is that object instance), i.e., the instance pointed to by Java object header’s type pointer:InstanceKlass: Klass for regular object classes:InstanceRefKlass: Klass forjava.lang.ref.Referenceclass and subclassesInstanceClassLoaderKlass: Klass for Java class loadersInstanceMirrorKlass: Klass forjava.lang.Class
ArrayKlass: Klass for Java arraysObjArrayKlass: Klass for regular object arraysTypeArrayKlass: Klass for primitive type arrays
Located in data metaspace:
Symbol: Symbol constants, i.e., all symbolic strings in classes, such as class names, method names, method definitions, etc.ConstantPool: Runtime constant pool, data from the constant pool in class files.ConstanPoolCache: Runtime constant pool cache, used to accelerate constant pool accessConstMethod: After parsing methods from class files, static information goes into ConstMethod. This information can be understood as immutable, such as bytecode, line numbers, method exception tables, local variable tables, parameter tables, etc.MethodCounters: Method counter-related data.MethodData: Method data collection, dynamic compilation-related data. For example, certain methods need to collect metrics to decide whether to use C1 C2 dynamic compilation for performance optimization.Method: Java methods, containing pointers to the aboveConstMethod,MethodCounters,MethodDataplus some additional data.RecordComponent: Corresponds to Java 14’s new Record feature, i.e., key information parsed from Records.
We’ll explain these types in detail in the next series The Most Hardcore JVM Metaspace Analysis.
4.3. Core Concepts and Design of Metaspace#
4.3.1. Overall Metaspace Configuration and Related Parameters#
Metaspace configuration-related parameters:
MetaspaceSize: Initial metaspace size, also minimum metaspace size. During subsequent metaspace size adjustments, it won’t go below this size. Default is 21M.MaxMetaspaceSize: Maximum metaspace size, default is unsigned int maximum value.MinMetaspaceExpansion: Minimum change size during each metaspace size adjustment. Default is 256K. We’ll analyze this in detail when discussing metaspace memory size limits.MaxMetaspaceExpansion: Maximum change size during each metaspace size adjustment. Default is 4M. We’ll analyze this in detail when discussing metaspace memory size limits.MaxMetaspaceFreeRatio: Maximum metaspace free ratio, default is 70 (70%). We’ll analyze this in detail when discussing metaspace memory size limits.MinMetaspaceFreeRatio: Minimum metaspace free ratio, default is 40 (40%). We’ll analyze this in detail when discussing metaspace memory size limits.UseCompressedClassPointers: As mentioned earlier, whether to enable compressed class pointers. Default is enabled. In older versions,UseCompressedClassPointersdepended onUseCompressedOops- if compressed object pointers weren’t enabled, compressed class pointers couldn’t be enabled either. However, starting from Java 15 Build 23,UseCompressedClassPointersno longer depends onUseCompressedOops, and the two are independent in most cases, except when using JVM Compiler Interface (like GraalVM) on x86 CPUs. Reference JDK ISSUE: https://bugs.openjdk.java.net/browse/JDK-8241825 - Make compressed oops and compressed class pointers independent (x86_64, PPC, S390)CompressedClassSpaceSize: If compressed class pointers are enabled, metaspace is divided into class metaspace and data metaspace, otherwise only data metaspace exists. This parameter limits class metaspace size, range is 1M ~ 3G. Default size is 1G, or the smaller of 1G andMaxMetaspaceSize * 0.8ifMaxMetaspaceSizeis specified.CompressedClassSpaceBaseAddress: Class metaspace starting virtual memory address, typically not specified. Functions similarly to the heap starting position analyzed earlier for heap memory.MetaspaceReclaimPolicy: Can bebalanced,aggressive, ornone. Note thatnoneis being removed (https://bugs.openjdk.org/browse/JDK-8302385). Default isbalanced. This mainly affects underlying metaspace-related configurations, which we’ll analyze in detail below.
Underlying metaspace-related configurations include:
- commit granularity - commit_granule: From Chapter 2’s analysis, we know JVM space is generally first reserved, then commits part of the reserved space before use. This commit granularity represents the minimum granularity for committing memory in metaspace. Metaspace uses this as the minimum size unit when expanding or contracting.
- virtual space node memory size - virtual_space_node_default_word_size: This is the virtual memory size of
VirtualSpaceNodethat we’ll analyze in detail later. Size is 64 MB in 64-bit environments. - virtual space node memory alignment - virtual_space_node_reserve_alignment_words: This is the alignment size that
VirtualSpaceNode’s virtual memory size needs to align to, meaning the total size must be greater than and a multiple of this alignment size. This size is the maximum size ofMetaChunk, which is 4MB. - whether to try expanding current MetaChunk when current MetaChunk is insufficient for allocation - enlarge_chunks_in_place: This parameter is true in official JVM and cannot be modified. We’ll analyze what
MetaChunkis in detail later. Simply put, metaspace uses a design similar to Linux buddy allocation algorithm with similar abstractions, where the memory allocation unit is Chunk, corresponding to MetaChunk in metaspace. - whether to commit all MetaChunk memory at once when allocating new MetaChunk - new_chunks_are_fully_committed: We’ll analyze what
MetaChunkis in detail later. - whether to release all MetaChunk memory back to OS when entire MetaChunk space is unused - uncommit_free_chunks: We’ll analyze what
MetaChunkis in detail later.
Starting from Java 16, elastic metaspace was introduced. The old metaspace had relatively large allocation granularity and poor space release strategy design, potentially causing high memory usage. Starting with Java 16, JEP 387: Elastic Metaspace introduced elastic metaspace design, which is what we’ll discuss here. This elastic metaspace also introduced an important parameter -XX:MetaspaceReclaimPolicy.
MetaspaceReclaimPolicy: Can be balanced, aggressive, or none. Note that none is being removed (https://bugs.openjdk.org/browse/JDK-8302385). The specific effects of these three configurations are:

4.3.2. Metaspace Context MetaspaceContext#
MetaspaceContext itself is allocated directly on the native heap, belonging to the Metaspace category in Native Memory Tracking, i.e., space occupied by metaspace abstraction classes.
class MetaspaceContext : public CHeapObj<mtMetaspace>
JVM metaspace establishes two metaspace contexts (MetaspaceContext) globally: one for class metaspace (we’ll call it class metaspace MetaspaceContext), and one for data metaspace (we’ll call it data metaspace MetaspaceContext). Of course, when compressed class pointers aren’t enabled, only one data metaspace MetaspaceContext is initialized, and only the data metaspace MetaspaceContext is used for allocation. However, in our subsequent discussion, we’ll only discuss the case where compressed class pointers are enabled, as this is the default and common situation.
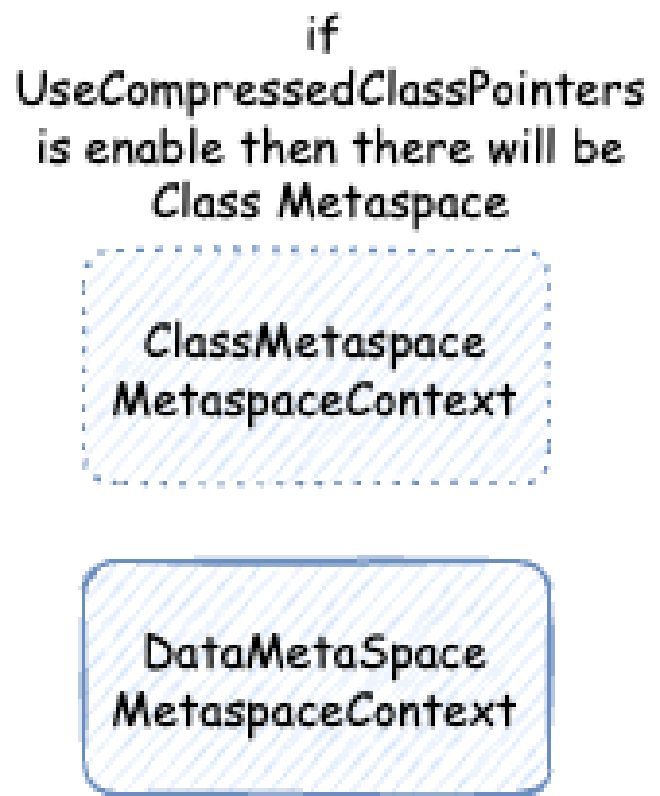
Each MetaspaceContext corresponds to an independent VirtualSpaceList and an independent ChunkManager.
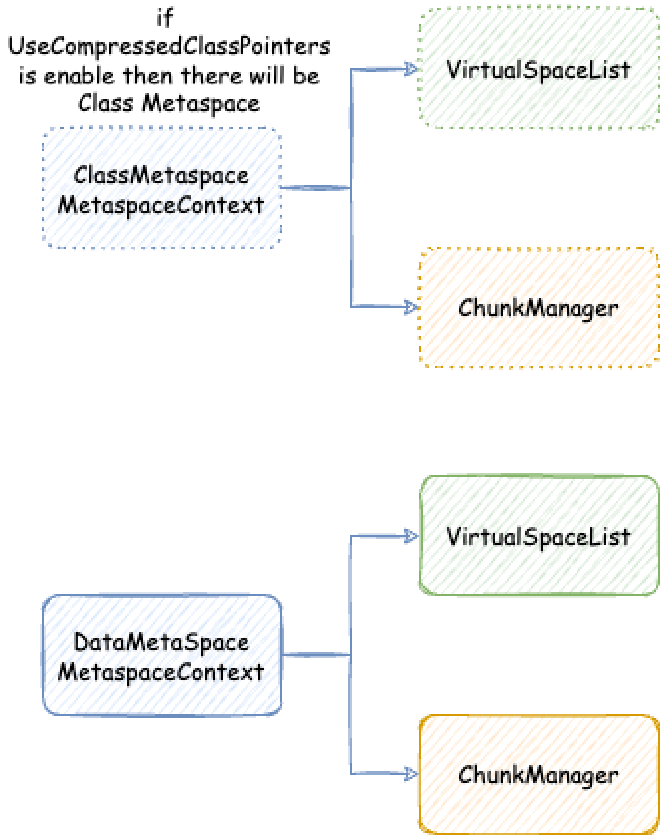
Each element in this VirtualSpaceList is a VirtualSpaceNode. As the name suggests, VirtualSpaceNode is an intermediate abstraction layer that requests memory from the operating system and isolates metaspace memory partitioning. VirtualSpaceList is responsible for interacting with the operating system to request or release memory. Metaspace interacts with VirtualSpaceList to use memory.
ChunkManager, as the name suggests, manages all Chunks. The Chunk concept frequently appears in various buddy memory management algorithm frameworks (Buddy Allocator), generally referring to the minimum unit of memory management allocation. Here, the Chunk abstraction corresponds to MetaChunk. ChunkManager obtains a large continuous memory MetaChunk (actually RootMetaChunk) from VirtualSpaceList, then continuously splits this RootMetaChunk in half according to allocation requirements to the needed size, returning this appropriately sized MetaChunk. The remaining split MetaChunks enter FreeChunkListVector for use in subsequent MetaChunk allocations, eliminating the need to obtain from VirtualSpaceList again.
Let’s analyze VirtualSpaceList and ChunkManager in detail.
4.3.3. Virtual Space List VirtualSpaceList#
VirtualSpaceList itself is allocated directly on the native heap, belonging to the Class category in Native Memory Tracking, i.e., space occupied by metaspace’s loaded classes. I personally feel this design isn’t quite reasonable; it should belong to the same category as MetaspaceContext. The actual space occupied by loaded classes is allocated from memory marked on VirtualSpaceNode, which is what we’ll analyze in the next subsection.
class VirtualSpaceList : public CHeapObj<mtClass>
First, let me mention that class metaspace MetaspaceContext and data metaspace MetaspaceContext differ slightly: the VirtualSpaceList of class metaspace MetaspaceContext cannot be extended to request new memory, but the VirtualSpaceList of data metaspace MetaspaceContext can. In other words: the VirtualSpaceList of class metaspace MetaspaceContext actually only has one VirtualSpaceNode, but the VirtualSpaceList of data metaspace MetaspaceContext is truly a list containing multiple VirtualSpaceNodes.
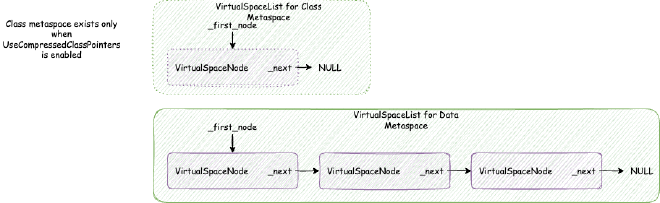
4.3.4. Virtual Space Node VirtualSpaceNode and CompressedClassSpaceSize#
VirtualSpaceNode itself is allocated directly on the native heap, belonging to the Class category in Native Memory Tracking, i.e., space occupied by metaspace’s loaded classes. I personally feel this design isn’t quite reasonable; it should belong to the same category as MetaspaceContext. The actual space occupied by loaded classes is allocated from memory addresses marked on VirtualSpaceNode. VirtualSpaceNode itself only serves a descriptive recording purpose and should also belong to the metaspace description category.
class VirtualSpaceNode : public CHeapObj<mtClass>
VirtualSpaceNode is an abstraction of a continuous virtual memory space. The VirtualSpaceList of class metaspace contains only one VirtualSpaceNode, sized as the previously mentioned CompressedClassSpaceSize.
Data metaspace doesn’t reserve the maximum heap memory limit all at once like class metaspace or heap memory, but reserves VirtualSpaceNode size each time. VirtualSpaceNode size is 64 MB in 64-bit environments:
static const size_t _virtual_space_node_default_word_size =
      chunklevel::MAX_CHUNK_WORD_SIZE * NOT_LP64(2) LP64_ONLY(16); // 8MB (32-bit) / 64MB (64-bit)
VirtualSpaceNode manages its maintained virtual memory space through two data structures:
CommitMask: Actually a bitmap used to maintain which memory has been committed and which hasn’t. The bitmap’s marking unit is the previously mentioned commit_granule (commit granularity).RootChunkAreaLUT: Used to maintain memory distribution of eachRootMetaChunk. We’ll explain whatRootMetaChunkis when we discussMetaChunklater.
4.3.5. MetaChunk#
MetaChunk is the core abstraction for metaspace memory allocation. Its essence is describing a continuous virtual memory space. MetaChunk itself is just a description object allocated directly on the native heap, belonging to the Metaspace category in Native Memory Tracking, i.e., space occupied by metaspace abstraction classes. This description object is pooled, referencing the ChunkHeaderPool we’ll analyze later.
Any allocation in metaspace occurs on some MetaChunk. MetaChunk has a level concept, i.e., ChunkLevel. Each MetaChunk has its own ChunkLevel, which mainly represents the size of memory space described by the MetaChunk. Each level is twice the size of the next level:
| ChunkLevel | Size | ChunkLevel | Size | ChunkLevel | Size |
|---|---|---|---|---|---|
| 0 | 4MB | 4 | 256KB | 8 | 16KB |
| 1 | 2MB | 5 | 128KB | 9 | 8KB |
| 2 | 1MB | 6 | 64KB | 10 | 4KB |
| 3 | 512KB | 7 | 32KB | 11 | 2KB |
| 12 | 1KB |
MetaChunks directly partitioned from VirtualSpaceNode are RootMetaChunks with the highest ChunkLevel of 0, size 4MB, and their memory is only reserved, not yet committed.
MetaChunk has three states:
Dead: TheMetaChunkobject is created but not associated with actual virtual memory. As we’ll learn later,MetaChunkis pooled and reusable, with the pool beingChunkHeaderPool. Those inChunkHeaderPoolthat aren’t yet associated with actual virtual memory haveDeadstatus.Free: TheMetaChunkis associated with actual virtual memory but not actually used. At this time, thisMetaChunkis managed byChunkManager.InUse: TheMetaChunkis associated with actual virtual memory and actually used. At this time,MetaChunkArenamanages memory allocation on thisMetaChunk.
4.3.5.1. ChunkHeaderPool Pools MetaChunk Objects#
MetaChunk is actually just a description class for a continuous virtual memory space, i.e., a metadata class. Since class loading requires various sizes and frequently involves merging, splitting, etc., there might be many MetaChunks. To save space occupied by this metadata class, metaspace pools them for recycling and reuse. This pool is ChunkHeaderPool. For example, when directly partitioning RootMetaChunk memory space from VirtualSpaceNode, a MetaChunk is requested from ChunkHeaderPool for description. When two MetaChunks’ spaces need to be merged into one, one MetaChunk becomes useless and is returned to ChunkHeaderPool instead of being directly freed.
ChunkHeaderPool itself is allocated directly on the native heap, belonging to the Metaspace category in Native Memory Tracking, i.e., space occupied by metaspace abstraction classes.
class ChunkHeaderPool : public CHeapObj<mtMetaspace>
From this, we can infer that MetaChunk itself is also allocated directly on the native heap, also belonging to the Metaspace category in Native Memory Tracking.
The structure of ChunkHeaderPool is:

The ChunkHeaderPool mechanism is quite simple:
- Requesting
MetaChunkfor describing memory:- First check
_freelistfor previously returnedMetaChunks available for use. If available, return thatMetaChunkand remove it from_freelist - If none available, read the
Slabpointed to by_current_slab.Slab’s core is a pre-allocatedMetaChunkarray (size 128), with_topindicating which array element is currently in use. - If
_tophasn’t reached 128, return theMetaChunkrepresented by_topand increment_topby 1. - If
_topreaches 128, create a newSlaband point_current_slabto this newSlab
- First check
- Recycling
MetaChunk: Put into_freelist
4.3.5.2. ChunkManager Manages Free MetaChunks#
ChunkManager itself is allocated directly on the native heap, belonging to the Metaspace category in Native Memory Tracking, i.e., space occupied by metaspace abstraction classes.
class ChunkManager : public CHeapObj<mtMetaspace>
https://github.com/openjdk/jdk/blob/jdk-21%2B11/src/hotspot/share/memory/metaspace/chunkManager.hpp
ChunkManager manages MetaChunks that are already associated with memory but not yet used (status Free). When first allocating RootMetaChunk memory from VirtualSpaceNode, based on the requested memory size, it decides to split the RootMetaChunk to a certain ChunkLevel size for current allocation. Other split MetaChunks that aren’t used yet are placed in a structure similar to the _free_list in ChunkHeaderPool for use when next requesting MetaChunk for allocation, eliminating the need to allocate new RootMetaChunk from VirtualSpaceNode.
The overall structure of ChunkManager is:
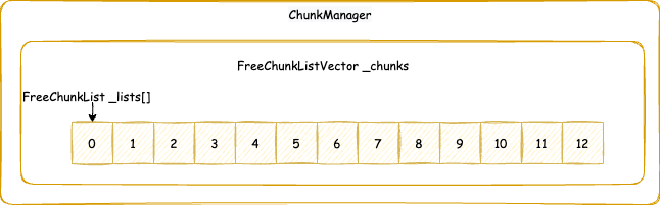
ChunkManager mainly maintains a FreeChunkListVector, which contains a FreeChunkList array. FreeChunkList is a MetaChunk linked list containing Free MetaChunks. MetaChunks of the same ChunkLevel are in the same FreeChunkList. The FreeChunkList array is indexed by ChunkLevel, allowing quick location of a MetaChunk of the required ChunkLevel. FreeChunkList is actually a doubly-linked list with head and tail pointers. If a MetaChunk’s managed memory has been committed, it’s placed at the list head; uncommitted ones are placed at the list tail.
Specific MetaChunk allocation, splitting, and merging processes will be analyzed in detail after introducing MetaspaceArena. However, unlike ChunkManager, which is globally two (one for class metaspace, one for data metaspace, or just one data metaspace ChunkManager if compressed class pointers aren’t enabled), MetaspaceArena is private to each ClassLoader, as we’ll see later. So before discussing MetaspaceArena, we need to approach from another angle - the ClassLoader class loading perspective - and analyze layer by layer down to MetaspaceArena.
4.3.6. Class Loading Entry Point SystemDictionary and ClassLoaderDataGraph Containing All ClassLoaderData#
The class loading entry point is in the globally unique SystemDictionary. Here we just want to see what parameters class loading needs to understand the corresponding relationships, without worrying about details. The entry code is:
https://github.com/openjdk/jdk/blob/jdk-21%2B11/src/hotspot/share/classfile/systemDictionary.cpp
InstanceKlass* SystemDictionary::resolve_from_stream(ClassFileStream* st,
                                                     Symbol* class_name,
                                                     Handle class_loader,
                                                     const ClassLoadInfo& cl_info,
                                                     TRAPS) {
  // Hidden classes and regular classes load differently; hidden classes are introduced by JEP 371: Hidden Classes, a new feature released in Java 15
  if (cl_info.is_hidden()) {
    return resolve_hidden_class_from_stream(st, class_name, class_loader, cl_info, CHECK_NULL);
  } else {
    return resolve_class_from_stream(st, class_name, class_loader, cl_info, CHECK_NULL);
  }
}
We can see that loading a class requires the following parameters:
ClassFileStream* st: Class file streamSymbol* class_name: Name of the class to loadHandle class_loader: Which class loaderconst ClassLoadInfo& cl_info: Class loader information
When loading classes, SystemDictionary obtains the class loader’s ClassLoaderData, which is private to each class loader.
https://github.com/openjdk/jdk/blob/jdk-21%2B11/src/hotspot/share/classfile/systemDictionary.cpp
// Get corresponding `ClassLoaderData` through class loader
ClassLoaderData* SystemDictionary::register_loader(Handle class_loader, bool create_mirror_cld) {
  if (create_mirror_cld) {
    return ClassLoaderDataGraph::add(class_loader, true);
  } else {
    // If null, represents BootstrapClassLoader, use global BootstrapClassLoader's corresponding ClassLoaderData
    return (class_loader() == NULL) ? ClassLoaderData::the_null_class_loader_data() :
    // Otherwise, find or create ClassLoaderData corresponding to class_loader from ClassLoaderDataGraph
                                      ClassLoaderDataGraph::find_or_create(class_loader);
  }
}
ClassLoaderDataGraph contains all ClassLoaderData, mainly used to iterate through each class loader and get information about classes loaded by each class loader, as well as iterate through classes loaded by class loaders. For example, jcmd commands VM.classloaders and VM.classloader_stats are implemented this way. However, we won’t delve into ClassLoaderDataGraph details as it’s not our focus.
4.3.7. Each Class Loader’s Private ClassLoaderData and ClassLoaderMetaspace#
ClassLoaderData itself is allocated directly on the native heap, belonging to the Class category in Native Memory Tracking, i.e., space occupied by metaspace’s loaded classes. This makes sense - no ClassLoaderData exists without loading classes.
https://github.com/openjdk/jdk/blob/jdk-21%2B11/src/hotspot/share/classfile/classLoaderData.hpp
class ClassLoaderData : public CHeapObj<mtClass>
As mentioned earlier, ClassLoaderData is private to each class loader. ClassLoaderData contains many elements; we only focus on those related to metaspace memory allocation, namely ClassLoaderMetaspace:
https://github.com/openjdk/jdk/blob/jdk-21%2B11/src/hotspot/share/classfile/classLoaderData.hpp
ClassLoaderMetaspace * volatile _metaspace;
ClassLoaderMetaspace itself is allocated directly on the native heap, belonging to the Class category in Native Memory Tracking, i.e., space occupied by metaspace’s loaded classes.
https://github.com/openjdk/jdk/blob/jdk-21%2B11/src/hotspot/share/memory/classLoaderMetaspace.hpp
class ClassLoaderMetaspace : public CHeapObj<mtClass>
ClassLoaderMetaspace has different types (MetaspaceType):
MetaspaceType::StandardMetaspaceType:ClassLoaderMetaspacefor Platform ClassLoader (called ext ClassLoader before Java 9) and Application ClassLoaderMetaspaceType::BootMetaspaceType:ClassLoaderMetaspacefor Bootstrap ClassLoaderMetaspaceType::ClassMirrorHolderMetaspaceType:ClassLoaderMetaspacefor class loaders loading anonymous classesMetaspaceType::ReflectionMetaspaceType: The first few reflection calls use jni native calls, but after a certain number of times, they’re optimized to generate bytecode class calls. The class loader loading these bytecode classes isjdk.internal.reflect.DelegatingClassLoader, and this class loader’sClassLoaderMetaspacetype isReflectionMetaspaceType.
Like MetaspaceContext, if compressed class pointers are enabled, ClassLoaderMetaspace contains one class metaspace MetaspaceArena and one data metaspace MetaspaceArena; otherwise, it only has one data metaspace MetaspaceArena.
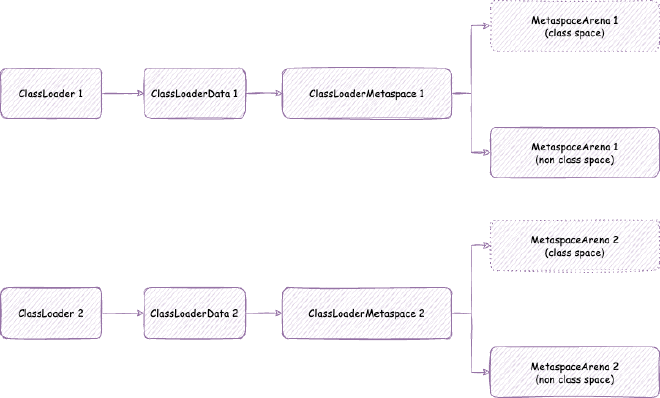
4.3.8. MetaspaceArena Managing In-Use MetaChunks#
MetaspaceArena itself is allocated directly on the native heap, belonging to the Class category in Native Memory Tracking, i.e., space occupied by metaspace’s loaded classes. This makes sense since it exists with class loaders.
class MetaspaceArena : public CHeapObj<mtClass>
The structure of MetaspaceArena is shown below:
MetaspaceArena contains:
- A
MetachunkList: List managingMetaChunks allocated in thisMetaspaceArena, with the first one being the current memory-allocatingMetaChunk. - Current
MetaspaceArena’sArenaGrowthPolicy: Size of newMetaChunkto request when current memory-allocatingMetaChunkis insufficient for allocation. Freeblocks: When current memory-allocatingMetaChunkis insufficient for allocation, a newMetaChunkneeds to be allocated. The remaining space of the currentMetaChunkgoes intoFreeblocks.
Freeblocks contains a BinList32 and a BlockTree. Blocks larger than 33 bytes go into BlockTree; otherwise, they go into BinList32.
BinList32 is similar to FreeChunkListVector - an array of linked lists where same-sized memory blocks are in the same array index’s linked list.
BlockTree is a data structure based on Binary Search Tree (BST) where nodes with the same memory size form a linked list behind the binary tree node.
Different class loader types have different ArenaGrowthPolicy for class metaspace MetaspaceArena and data metaspace MetaspaceArena:
- Bootstrap ClassLoader’s
ClassLoaderMetaspaceclass metaspaceMetaspaceArena’sArenaGrowthPolicy: EachMetachunkListgrowth requestsMetaChunkof size256K
static const chunklevel_t g_sequ_boot_class[] = {
    chunklevel::CHUNK_LEVEL_256K
    // .. repeat last
};
- Bootstrap ClassLoader’s
ClassLoaderMetaspacedata metaspaceMetaspaceArena’sArenaGrowthPolicy:MetachunkList’s firstMetaChunksize is4M, subsequent newMetaChunks are all1M:
static const chunklevel_t g_sequ_boot_non_class[] = {
    chunklevel::CHUNK_LEVEL_4M,
    chunklevel::CHUNK_LEVEL_1M
    // .. repeat last
};
- Platform ClassLoader and Application ClassLoader’s
ClassLoaderMetaspaceclass metaspaceMetaspaceArena’sArenaGrowthPolicy:MetachunkList’s firstMetaChunksize is2K, second is also2K, third is4K, fourth is8K, subsequent newMetaChunks are all16K:
static const chunklevel_t g_sequ_standard_class[] = {
    chunklevel::CHUNK_LEVEL_2K,
    chunklevel::CHUNK_LEVEL_2K,
    chunklevel::CHUNK_LEVEL_4K,
    chunklevel::CHUNK_LEVEL_8K,
    chunklevel::CHUNK_LEVEL_16K
    // .. repeat last
};
- Platform ClassLoader and Application ClassLoader’s
ClassLoaderMetaspacedata metaspaceMetaspaceArena’sArenaGrowthPolicy:MetachunkList’s firstMetaChunksize is4K, second is also4K, third is4K, fourth is8K, subsequent newMetaChunks are all16K:
static const chunklevel_t g_sequ_standard_non_class[] = {
    chunklevel::CHUNK_LEVEL_4K,
    chunklevel::CHUNK_LEVEL_4K,
    chunklevel::CHUNK_LEVEL_4K,
    chunklevel::CHUNK_LEVEL_8K,
    chunklevel::CHUNK_LEVEL_16K
    // .. repeat last
};
- Anonymous class loader’s
ClassLoaderMetaspaceclass metaspaceMetaspaceArena’sArenaGrowthPolicy: EachMetachunkListgrowth requestsMetaChunkof size1K:
static const chunklevel_t g_sequ_anon_class[] = {
    chunklevel::CHUNK_LEVEL_1K,
    // .. repeat last
};
- Anonymous class loader’s
ClassLoaderMetaspacedata metaspaceMetaspaceArena’sArenaGrowthPolicy: EachMetachunkListgrowth requestsMetaChunkof size1K:
static const chunklevel_t g_sequ_anon_non_class[] = {
   chunklevel::CHUNK_LEVEL_1K,
   // .. repeat last
};
DelegatingClassLoader’sClassLoaderMetaspaceclass metaspaceMetaspaceArena’sArenaGrowthPolicy: EachMetachunkListgrowth requestsMetaChunkof size1K:
static const chunklevel_t g_sequ_refl_class[] = {
    chunklevel::CHUNK_LEVEL_1K,
    // .. repeat last
};
DelegatingClassLoader’sClassLoaderMetaspacedata metaspaceMetaspaceArena’sArenaGrowthPolicy:MetachunkList’s firstMetaChunksize is2K, subsequent newMetaChunks are all1K:
static const chunklevel_t g_sequ_refl_non_class[] = {
    chunklevel::CHUNK_LEVEL_2K,
    chunklevel::CHUNK_LEVEL_1K
    // .. repeat last
};
4.3.9. Metaspace Memory Allocation Process#
Let’s go through the metaspace memory allocation process. We’ll ignore some GC-related and concurrency safety details, as involving too many concepts would be overwhelming. These details will be mentioned in detail in future series.
4.3.9.1. Class Loader to MetaSpaceArena Process#
When a class loader loads classes, it needs to allocate metaspace from the corresponding ClassLoaderMetaspace for storage. This process roughly is:
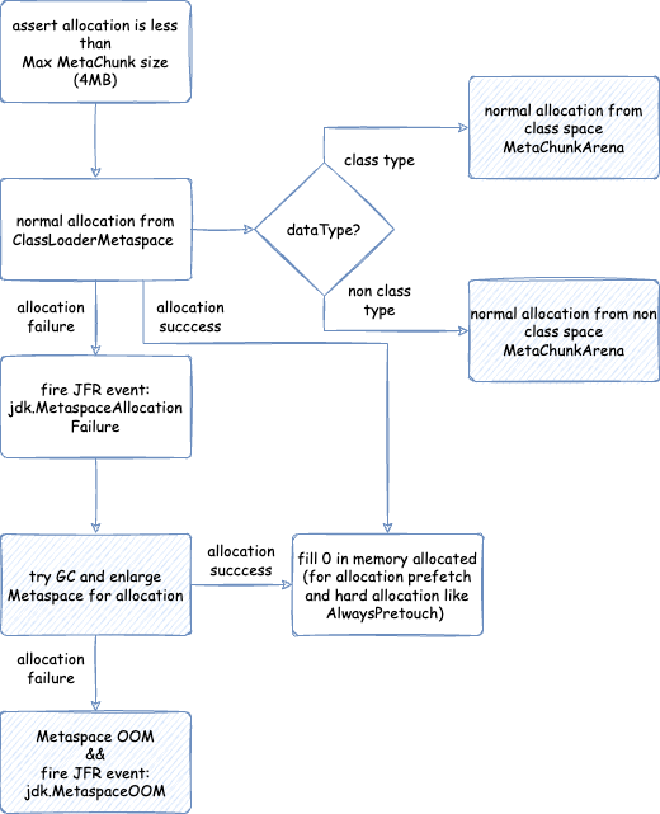
The blue-filled blocks in the diagram are the processes we want to analyze in detail. We’ll start by analyzing normal allocation from MetaChunkArena. Attempting GC and expanding metaspace for allocation involves concepts of metaspace size limits and GC thresholds, which we’ll analyze later. The corresponding source code is: https://github.com/openjdk/jdk/blob/jdk-21%2B12/src/hotspot/share/memory/metaspace.cpp#L899
The entire process is as follows:
- First, verify that the memory to be allocated is smaller than the maximum
MetaChunksize, i.e.,RootMetaChunksize, i.e.,ChunkLevel= 0 size, i.e.,4MB - Then, proceed with normal allocation process, determining whether the currently allocated data type belongs to class metaspace or data metaspace, and allocate to the corresponding class metaspace
MetaSpaceArenaor data metaspaceMetaSpaceArena. This is what we’ll analyze in detail in the next section. - If normal allocation fails, trigger the
jdk.MetaspaceAllocationFailureJFR event. You can monitor this event to adjust metaspace size and reduce GC triggered by insufficient metaspace. - After that, attempt GC and increase metaspace GC threshold (metaspace has maximum size limits, but also dynamically calculated GC thresholds; exceeding GC thresholds will cause step 2’s normal allocation to fail) for allocation. We’ll analyze this process in detail later.
- Finally, if allocation still fails, throw the famous
java.lang.OutOfMemoryError, triggering thejdk.MetaspaceOOMJFR event, which we’ll also analyze in detail.
We’ll first analyze step 2’s normal allocation process; others require subsequent analysis of metaspace size limits.
4.3.9.2. Normal Allocation from MetaChunkArena - Overall Process#
The normal allocation process from MetaChunkArena isn’t too complex:
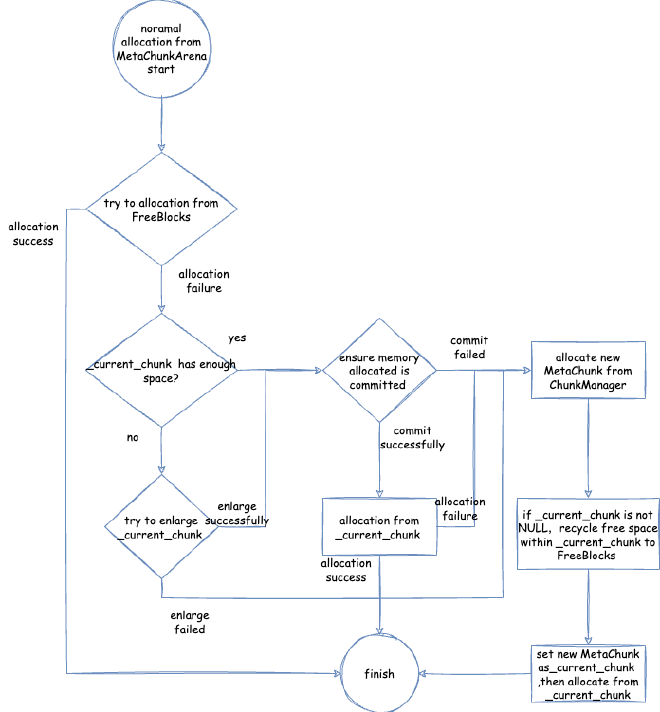
We previously discussed the structure of MetaspaceArena, shown below:
The corresponding source code is https://github.com/openjdk/jdk/blob/jdk-21%2B12/src/hotspot/share/memory/metaspace/metaspaceArena.cpp#L222. Combined with the flow diagram, we can organize a simple allocation approach:
- First, try allocating from
FreeBlocks(for first allocation,FreeBlocksdefinitely has no allocatable space, so proceed to next branch). If allocation succeeds, return directly. - Then, try allocating from
current chunk(for first allocation,current chunkis definitelyNULL, so proceed to next branch):- If
current chunkhas sufficient space and this space is committed or can be committed successfully, allocate fromcurrent chunk. - If
current chunkdoesn’t have sufficient space, try expandingcurrent chunk. If expansion succeeds and this space is committed or can be committed successfully, allocate fromcurrent chunk. - If expansion fails or commit fails, proceed to next branch.
- If
- If previous allocation failed, try requesting a new
MetaChunkfromChunkManager. - If request succeeds, add it to the current
MetaChunkList, pointcurrent chunkto the newMetaChunk, recycle the oldcurrent chunk’s remaining space toFreeBlocks, then allocate from the newcurrent chunk.
Next, we’ll analyze the process of FreeBlocks recycling old current chunk and using it for subsequent allocation.
4.3.9.3. Normal Allocation from MetaChunkArena - FreeBlocks Recycling Old current chunk and Using for Subsequent Allocation Process#
First, we mentioned earlier: Freeblocks contains a BinList32 and a BlockTree. Blocks larger than 33 bytes go into BlockTree; otherwise, they go into BinList32.
BinList32 is similar to FreeChunkListVector - an array of linked lists where same-sized memory blocks are in the same array index’s linked list.
BlockTree is a data structure based on Binary Search Tree (BST) where nodes with the same memory size form a linked list behind the binary tree node.
The recycling process is very simple - just determine the remaining space of current chunk and place it in different data structures based on size: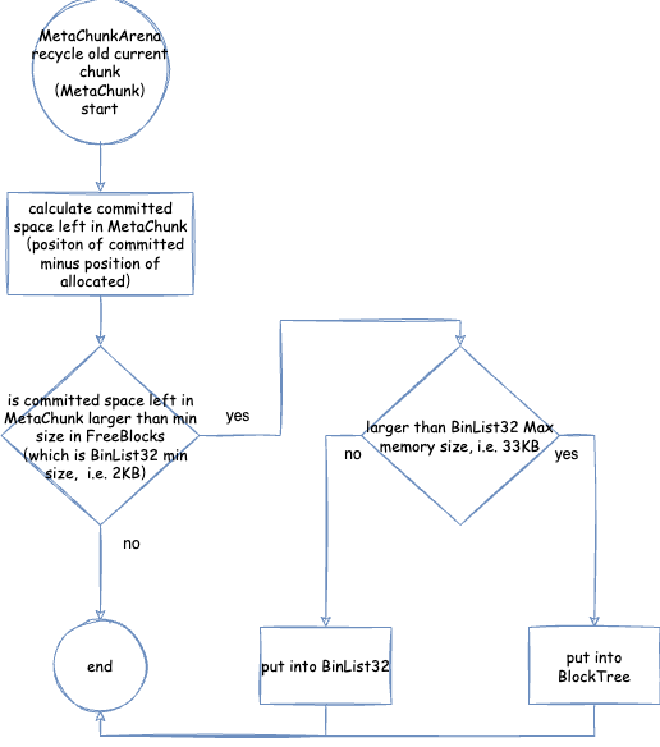
The corresponding source code is https://github.com/openjdk/jdk/blob/jdk-21%2B12/src/hotspot/share/memory/metaspace/metaspaceArena.cpp#L60:
- Calculate
MetaChunk’s remainingcommittedspace (simply subtract allocated position fromcommittedposition) - Determine if remaining space is larger than
FreeBlocksminimum memory block size (i.e.,BinList32minimum size of2KB) - Allocate the remaining
committedspace fromMetaChunkand place it inFreeBlocks - If memory is larger than
BinList32maximum memory block size of33KB, place inBlockTree; otherwise, place inBinList32
4.3.9.4. Normal Allocation from MetaChunkArena - Attempting Allocation from FreeBlocks#
Attempting allocation from FreeBlocks means searching BinList32 and BlockTree for suitable memory. The process is:
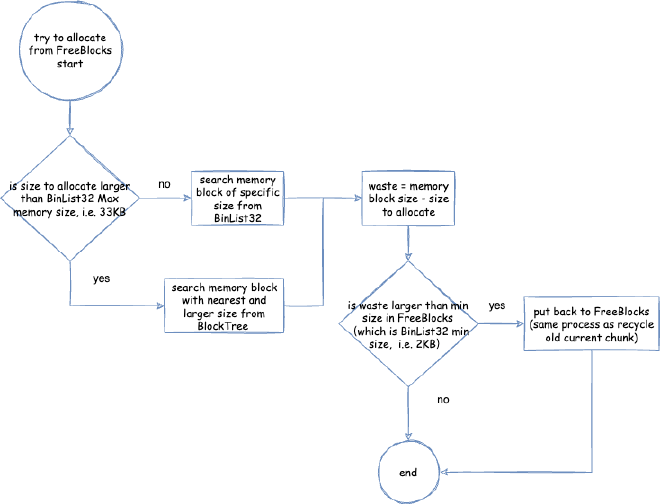
The corresponding source code is https://github.com/openjdk/jdk/blob/jdk-21%2B12/src/hotspot/share/memory/metaspace/freeBlocks.cpp#L42
- First determine if the memory size to allocate is larger than
BinList32maximum memory block size of33KB: if larger, searchBlockTreefor the closest memory block not smaller than the memory size; if not larger, searchBinList32for a memory block of corresponding size. - If found, calculate
waste, wherewaste = memory block size - memory size to allocate. - Determine if
wasteis larger thanFreeBlocksminimum memory block size (i.e.,BinList32minimum size of2KB). If larger, recycling is needed - place remaining memory back intoFreeBlocksusing the same process as recyclingMetaChunk.
4.3.9.5. Normal Allocation from MetaChunkArena - Attempting to Expand current chunk#
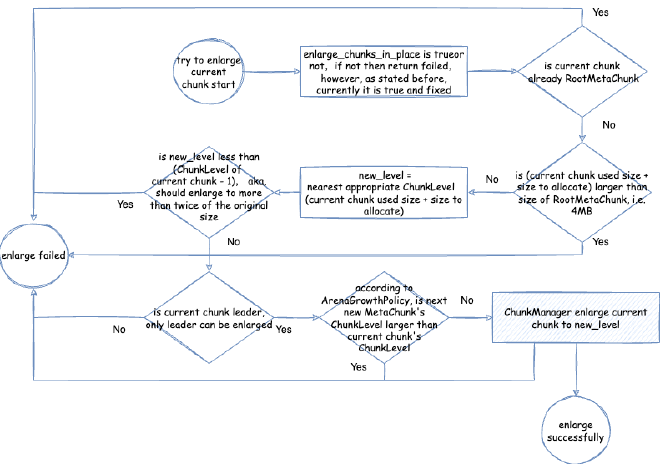
The corresponding source code is https://github.com/openjdk/jdk/blob/jdk-21%2B12/src/hotspot/share/memory/metaspace/metaspaceArena.cpp#L171
- Check if
enlarge_chunks_in_placeistrue; if not, end directly. However, as mentioned earlier, currentJVMhas this hardcoded astrue. - Determine if
current chunkis alreadyRootMetaChunk(meaning it can’t be expanded further); if so, end directly - Check if
current chunkused size plus memory size to allocate exceedsRootMetaChunksize of4MB(meaning it can’t be expanded further); if so, end directly - Find the closest
ChunkLevel(recorded asnew_level) that’s larger thancurrent chunkused size plus memory size to allocate - Determine if
new_levelis less thancurrent chunk’sChunkLevelminus 1, meaning the expansion target size is more than twice the original size (expansion of more than twice at once isn’t allowed); if so, end directly - Check if
current chunkisleader(this concept will be mentioned when analyzing allocation of newMetaChunkusingChunkManager). Onlyleadercan expand; if not, end directly - Determine if the
ChunkLevelfor requesting the nextMetaChunkin the expansion strategy is greater thancurrent chunk’s (meaning the newly requested one is smaller). If so, end directly. Let’s emphasize why we don’t expand when theChunkLevelfor requesting the nextMetaChunkin the expansion strategy (ArenaGrowthPolicy) is greater thancurrent chunk(meaning the newly requested one is smaller). From the expansion strategies for variousClassLoadertypes listed earlier, for example,DelegatingClassLoader’sClassLoaderMetaspacedata metaspaceMetaspaceArena’sArenaGrowthPolicy:MetachunkList’s firstMetaChunksize is2K, subsequent newMetaChunks are all1K. Assumingcurrent chunkis the first one, the nextMetaChunk’sChunkLevelcorresponds to1K, which is greater thancurrent chunk’s currentChunkLevel, so we prioritize requesting new ones rather than expanding. After the second one, since subsequent newMetaChunks are all1K, we’ll try expanding rather than requesting new ones. - Use
ChunkManagerto try expandingcurrent chunktonew_level. The specific expansion process will be analyzed later.
4.3.9.6. Normal Allocation from MetaChunkArena - Allocating New MetaChunk from ChunkManager#
Let’s review the ChunkManager structure:
Allocating new MetaChunk from ChunkManager first tries searching FreeChunkListVector for suitable ones. As mentioned earlier, FreeChunkListVector is an array indexed by ChunkLevel, where each array element is a MetaChunk linked list. MetaChunks with more commits are placed at the list head, while completely uncommitted ones are placed at the list tail.
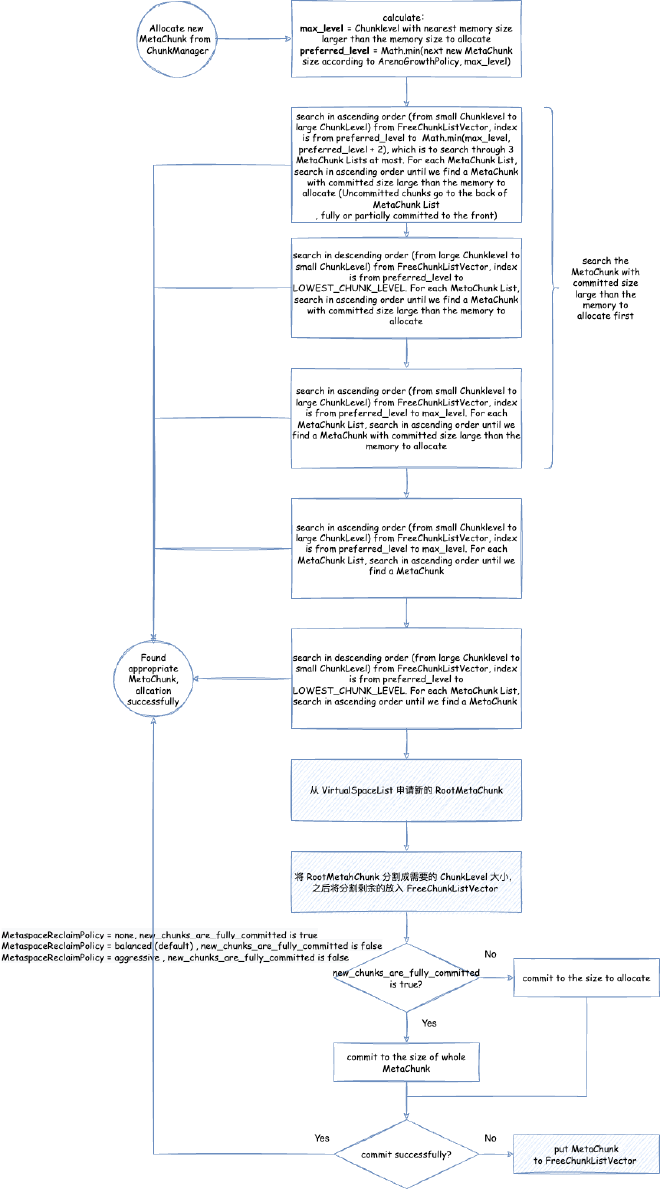
The corresponding source code is https://github.com/openjdk/jdk/blob/jdk-21%2B12/src/hotspot/share/memory/metaspace/chunkManager.cpp#L137
- Calculate two values:
max_level = closest ChunkLevel greater than current requested memory size (i.e., minimum size for new MetaChunk),preferred_level = smaller value between "next MetaChunk size according to expansion strategy (ArenaGrowthPolicy)" and "max_level" (i.e., larger MetaChunk size) - Prioritize searching and using
MetaChunks inFreeChunkListVectorthat have already committed sufficient memory - Forward traverse (i.e.,
ChunkLevelfrom small to large, size from large to small) the arrays inChunkManager’sFreeChunkListVector(frompreferred_levelto the smaller value betweenmax_levelandpreferred_level+ 2, i.e., search at most 3ChunkLevels; as analyzed earlier,ChunkLevelis the array index), find correspondingMetaChunklinked lists, forward traverse each list (as mentioned earlier,MetaChunks with more commits are at the head), until finding one with commit size greater than requested memory size - Reverse traverse (i.e.,
ChunkLevelfrom large to small, size from small to large) the arrays inChunkManager’sFreeChunkListVector(frompreferred_levelto maximumChunkLevel, i.e.,RootMetaChunksize of 4MB), find correspondingMetaChunklinked lists, forward traverse each list (as mentioned earlier,MetaChunks with more commits are at the head), until finding one with commit size greater than requested memory size - Forward traverse (i.e.,
ChunkLevelfrom small to large, size from large to small) the arrays inChunkManager’sFreeChunkListVector(frompreferred_leveltomax_level), find correspondingMetaChunklinked lists, forward traverse each list (as mentioned earlier,MetaChunks with more commits are at the head), until finding one with commit size greater than requested memory size - If no
MetaChunkwith sufficient committed memory is found, settle for finding any existingMetaChunkinFreeChunkListVector - Forward traverse (i.e.,
ChunkLevelfrom small to large, size from large to small) the arrays inChunkManager’sFreeChunkListVector(frompreferred_leveltomax_level), find correspondingMetaChunklinked lists, forward traverse each list, until finding aMetaChunk - Reverse traverse (i.e.,
ChunkLevelfrom large to small, size from small to large) the arrays inChunkManager’sFreeChunkListVector(frompreferred_levelto maximumChunkLevel, i.e.,RootMetaChunksize of 4MB), find correspondingMetaChunklinked lists, forward traverse each list, until finding aMetaChunk - If no suitable one is found above, request new
RootMetaChunkfromVirtualSpaceList - Split
RootMetahChunkinto neededChunkLevelsize, then place split remainders intoFreeChunkListVector. We’ll analyze this process in detail next. - Determine if
new_chunks_are_fully_committedistrue. If true, commit entireMetaChunk’s memory; otherwise, commit the size to be allocated. If commit fails (proving possible reach of metaspace GC threshold or metaspace size limit), return theMetaChunk.
4.3.9.7. Normal Allocation from MetaChunkArena - Allocating New MetaChunk from ChunkManager - Requesting New RootMetaChunk from VirtualSpaceList#
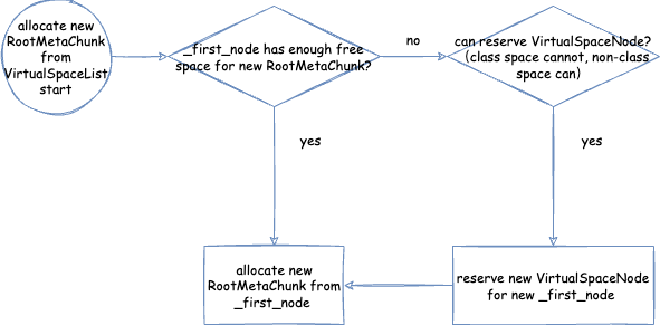
The corresponding source code is https://github.com/openjdk/jdk/blob/jdk-21+13/src/hotspot/share/memory/metaspace/virtualSpaceList.cpp#L110
- First determine if current
_first_nodehas space to allocate newRootMetaChunk. If so, allocate newRootMetaChunkfrom_first_node - If not, determine if new
VirtualSpaceNodecan be extended (class metaspace cannot, data metaspace can). If possible, requestReservefor newVirtualSpaceNodeas new_first_node, then allocate newRootMetaChunkfrom_first_node
4.3.9.8. Normal Allocation from MetaChunkArena - Allocating New MetaChunk from ChunkManager - Splitting RootMetaChunk into Needed MetaChunk#
Using a flow diagram here might be confusing, so let’s use an example. Suppose we want a MetaChunk with ChunkLevel 3:
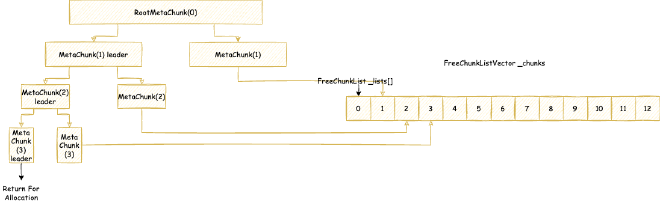
The corresponding source code is https://github.com/openjdk/jdk/blob/jdk-21%2B13/src/hotspot/share/memory/metaspace/chunkManager.cpp#L78
The process of splitting RootMetaChunk into a MetaChunk with ChunkLevel 3:
RootMetaChunkhasChunkLevel0, split in half into twoChunkLevel1s, first one isleader, second isfollower.- Split the previous step’s
leaderin half into twoChunkLevel2s, first one isleader, second isfollower. - Split the previous step’s
leaderin half into twoChunkLevel3s, first one isleader, second isfollower. - Return the third step’s
leaderfor allocation. Place thefollowers generated in steps 1, 2, and 3 intoFreeChunkListVectorfor use in theChunkManagersearch for suitableMetaChunkallocation analyzed in section 4.3.9.6.
4.3.9.9. MetaChunk Recycling - How MetaChunk is Placed into FreeChunkListVector in Different Situations#
We mainly analyzed allocation earlier, so how are MetaChunks recycled? From the previous processes, we can easily infer that they’re placed back into FreeChunkListVector. Using a flow diagram for the return process might be confusing, so let’s use examples to distinguish different situations. The core idea is that when returning, try to merge MetaChunks upward before returning:
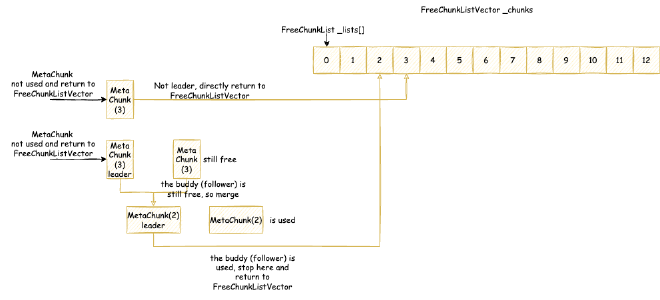
The corresponding source code is https://github.com/openjdk/jdk/blob/jdk-21%2B13/src/hotspot/share/memory/metaspace/chunkManager.cpp#L255
Here we have two examples:
- We have a
MetaChunkwithChunkLevel3 to recycle, but it’s not aleader, so it can’t merge upward. Onlyleaders attempt upward merging. This goes directly intoFreeChunkListVector. - We have another
MetaChunkwithChunkLevel3 to recycle, and it’s aleader. It will attempt upward merging. Check if itsfollowerisFree. If it’sFree, it’s definitely first inChunkManager’sFreeChunkListVector. Remove it fromFreeChunkListVectorand merge with thisleaderinto a newChunkLevel2. After that, it’s still aleader, so attempt continued merging, but itsfollowerisn’t free, so it can’t continue merging. Stop here and place intoFreeChunkListVector.
4.3.10. ClassLoaderData Recycling#
When GC determines a class loader can be recycled (classes loaded by the class loader have no objects, and no strong references point to the class loader object), ClassLoaderData isn’t immediately recycled. Instead, the corresponding ClassLoaderData’s is_alive() returns false. JVM periodically traverses ClassLoaderDataGraph, checking each ClassLoaderData’s is_alive(). If false, it’s placed in a pending recycling list. Later, during different phases of different GCs, this list is traversed to recycle ClassLoaderData.
The process of ClassLoaderData recycling is shown below:
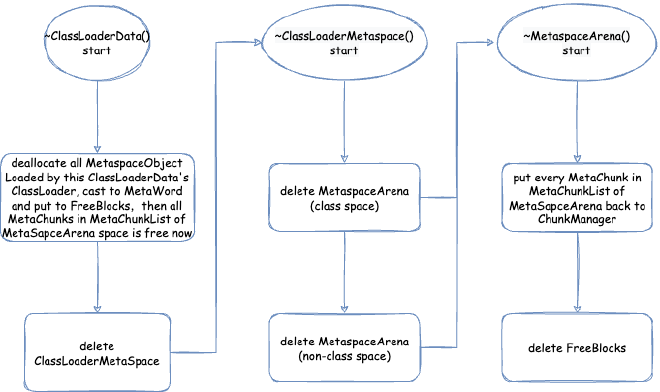
ClassLoaderData records all loaded classes and related data (the Klass and other objects mentioned earlier), so its destructor releases all this loaded data’s memory to its unique MetaSpaceArena’s FreeBlocks. This memory was allocated through the processes we analyzed earlier. Since previous space was all allocated from MetaChunks in MetaspaceArena’s MetaChunkList, these MetaChunks’ space is also no longer occupied. Of course, it also releases the previously mentioned ClassLoaderData’s unique data structures, placing unused MetaWords back into ChunkManager. Then, it clears its private ClassLoadMetaSpace. As analyzed earlier, ClassLoaderMetaspace includes one class metaspace MetaspaceArena and one data metaspace MetaspaceArena when compressed class space is enabled. These two MetaspaceArenas need to be cleaned up separately. MetaspaceArena’s destructor places each MetaWord in FreeBlocks back into ChunkManager, including the space for loaded class-related data that ClassLoaderData previously returned, and finally cleans up FreeBlocks.
4.4. Example of Metaspace Allocation and Recycling Process#
We previously introduced metaspace components but didn’t fully connect them. Here’s a simple example connecting all previous elements.
From our earlier analysis, we know metaspace’s main abstractions include:
- Globally unique class metaspace
MetaspaceContext, which includes:- One
VirtualSpaceList; class metaspace’sVirtualSpaceListhas only oneVirtualSpaceNode - One
ChunkManager
- One
- Globally unique data metaspace
MetaspaceContext, which includes:- One
VirtualSpaceList; data metaspace’sVirtualSpaceListis a true linked list ofVirtualSpaceNodes - One
ChunkManager
- One
- Each class loader has a unique
ClassLoaderData, containing its ownClassLoaderMetaspace, which includes:- One class metaspace
MetaspaceArena - One data metaspace
MetaspaceArena
- One class metaspace
Assuming we globally have only one class loader (class loader 1) and UseCompressedClassPointers is true, we can assume the current metaspace’s initial structure is:
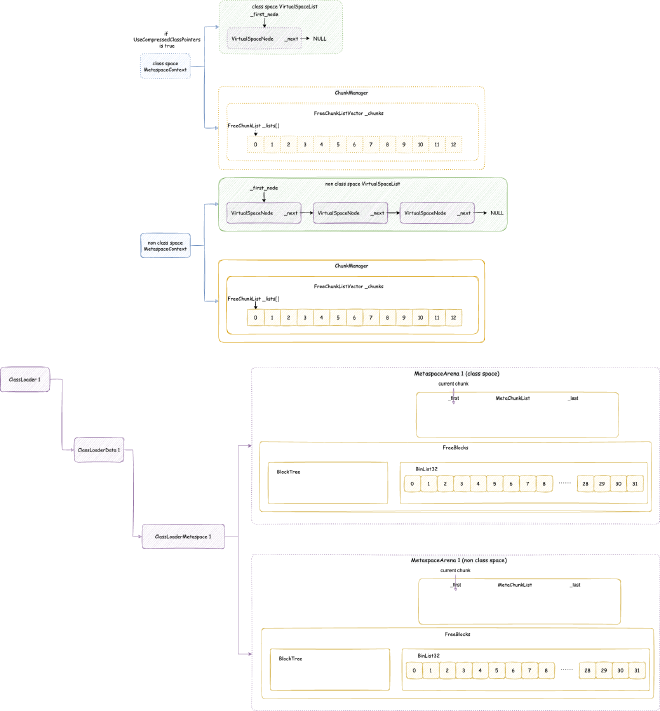
Let’s look at detailed examples.
4.4.1. First, Class Loader 1 Needs to Allocate 1023 Bytes of Memory for Class Space#

1-2. First, class loader 1 allocates space from its private ClassLoaderData. Since this is for class metaspace, it allocates from the private class metaspace MetaspaceArena.
Search
FreeBlocksfor available space, but this is the first allocation, so there’s definitely none.Try allocating from
_current_chunk, but since this is the first allocation,_current_chunkisNULL.

Align the memory to allocate (1023 bytes) to 8 bytes, i.e., 1024 bytes. The minimum
ChunkLevelgreater than or equal to it is 12, somax_level = 12. Assuming this class loader isBootstrap ClassLoader(doesn’t matter what it is, we mainly want to find a correspondingArenaGrowthPolicy), according to thisArenaGrowthPolicy, the firstMeataChunkto request is256KB, corresponding toChunkLevel4.preferred_levelis the smaller betweenmax_leveland this, which is 4. We request aMetaChunkof this size from class metaspace’sChunkManager, corresponding toChunkLevel4.First search
ChunkManager’sFreeChunkListVectorfor suitable ones. But this is the first allocation, so there’s definitely none.Try requesting
RootMetaChunkfrom class metaspace’sVirtualSpaceListfor allocation.
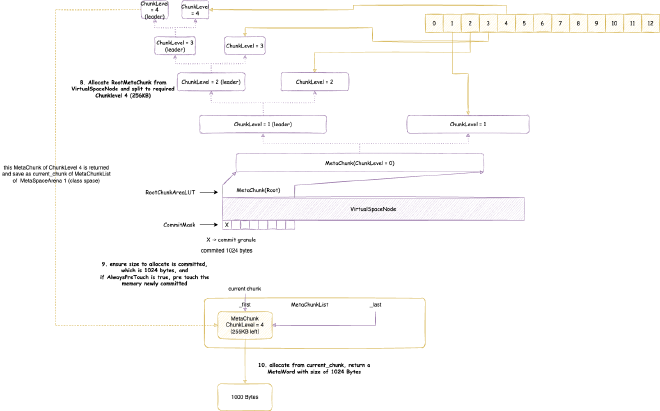
Allocate
RootMetaChunkfrom class metaspace’sVirtualSpaceList’s onlyVirtualSpaceNode, split in half toChunkLevel4MetaChunk, return theleaderChunkLevel4MetaChunkas_current_chunkfor allocation. Place the remaining splitChunkLevel1,ChunkLevel2,ChunkLevel3, andChunkLevel4 (one each) intoFreeChunkListVector.Commit the memory size to allocate. If
AlwaysPreTouchis enabled, perform pre-touch as we analyzed for Java heap memory earlier.Allocate memory from
_current_chunk, allocation succeeds.
4.4.2. Then Class Loader 1 Needs to Allocate Another 1023 Bytes for Class Space#
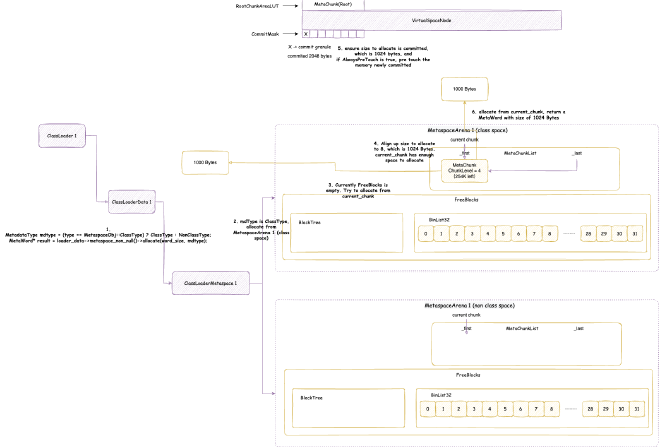
1-2. First, class loader 1 allocates space from its private ClassLoaderData. Since this is for class metaspace, it allocates from the private class metaspace MetaspaceArena.
Search
FreeBlocksfor available space, still none currently.Try allocating from
_current_chunk. Align the memory to allocate (1023 bytes) to 8 bytes, i.e., 1024 bytes._current_chunkhas sufficient space.Commit the memory size to allocate. If
AlwaysPreTouchis enabled, perform pre-touch as we analyzed for Java heap memory earlier.Allocate memory from
_current_chunk, allocation succeeds.
4.4.3. Then Class Loader 1 Needs to Allocate 264 KB for Class Space#
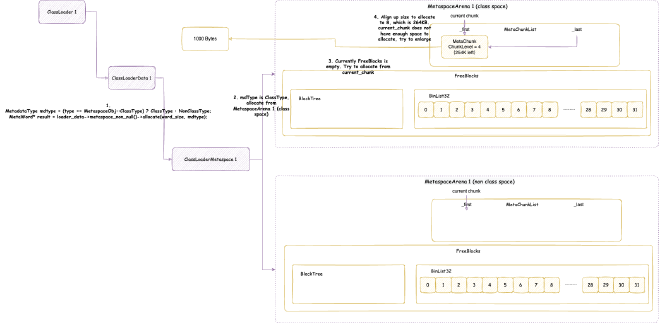
1-2. First, class loader 1 allocates space from its private ClassLoaderData. Since this is for class metaspace, it allocates from the private class metaspace MetaspaceArena.
Search
FreeBlocksfor available space, still none currently.Try allocating from
_current_chunk. Align the memory to allocate (264KB) to 8 bytes, i.e., 264KB._current_chunkdoesn’t have sufficient space, but doubling would be sufficient, so try expanding_current_chunk.
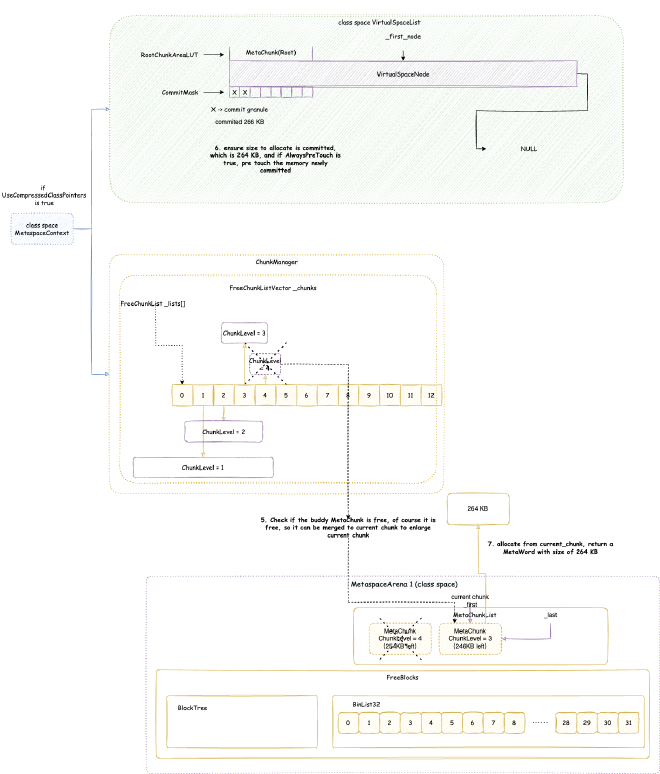
Check if its sibling
MetaChunkis free. Of course it is. Remove thisMetaChunkfromFreeChunkListVectorand merge this siblingMetaChunkwith_current_chunk._current_chunk’s size becomes twice the original, and_current_chunk’sChunkLeveldecreases by 1 to become 3.Commit the memory size to allocate. If
AlwaysPreTouchis enabled, perform pre-touch as we analyzed for Java heap memory earlier.Allocate memory from
_current_chunk, allocation succeeds.
4.4.4. Then Class Loader 1 Needs to Allocate 2 MB for Class Space#
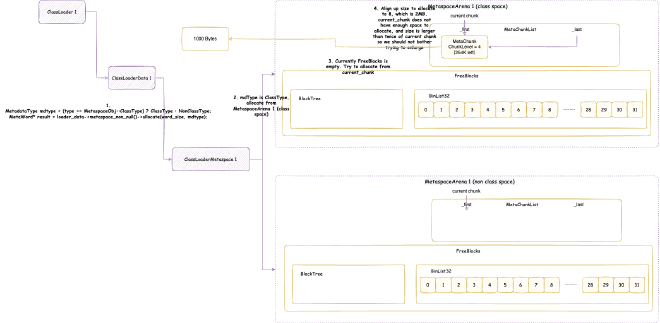
1-2. First, class loader 1 allocates space from its private ClassLoaderData. Since this is for class metaspace, it allocates from the private class metaspace MetaspaceArena.
Search
FreeBlocksfor available space, still none currently.Try allocating from
_current_chunk. Align the memory to allocate (2MB) to 8 bytes, i.e., 2MB._current_chunkdoesn’t have sufficient space, and doubling still wouldn’t be enough, so don’t try expanding_current_chunk.

The size to allocate is 2MB, with minimum
ChunkLevelgreater than or equal to it being 1, somax_level = 1. According toArenaGrowthPolicy, the nextMeataChunkto request is256KB, corresponding toChunkLevel4.preferred_levelis the smaller betweenmax_leveland this, which is 1. SearchFreeChunkListVectorand find a suitable one, use it ascurrent_chunkfor allocation.Commit the memory size to allocate. If
AlwaysPreTouchis enabled, perform pre-touch as we analyzed for Java heap memory earlier.The previous
current_chunk’s remaining space is greater than 2 bytes, so it needs to be recycled toFreeBlocks. Since it’s greater than 33 bytes, it goes intoBlockTree.Allocate memory from
_current_chunk, allocation succeeds.
4.4.5. Then Class Loader 1 Needs to Allocate 128KB for Class Space#
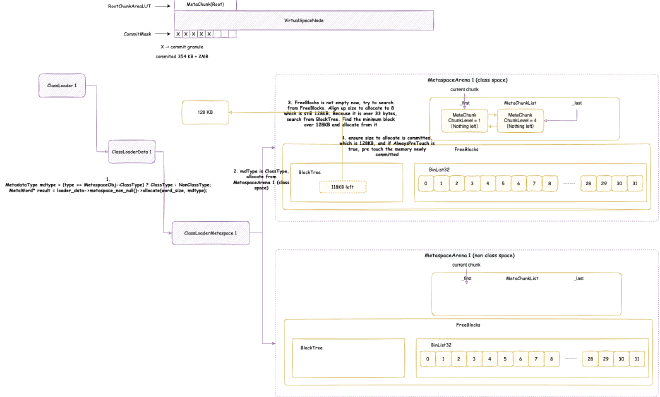
1-2. First, class loader 1 allocates space from its private ClassLoaderData. Since this is for class metaspace, it allocates from the private class metaspace MetaspaceArena.
Align the memory to allocate (128KB) to 8 bytes, i.e., 128KB. Search
FreeBlocksfor available space. CurrentlyFreeBlockshas suitable space for allocation.Commit the memory size to allocate. If
AlwaysPreTouchis enabled, perform pre-touch as we analyzed for Java heap memory earlier.Allocate memory from
FreeBlocks’BlockTreenode, allocation succeeds.
4.4.6. New Class Loader 2 Arrives, Needs to Allocate 1023 Bytes for Class Space#
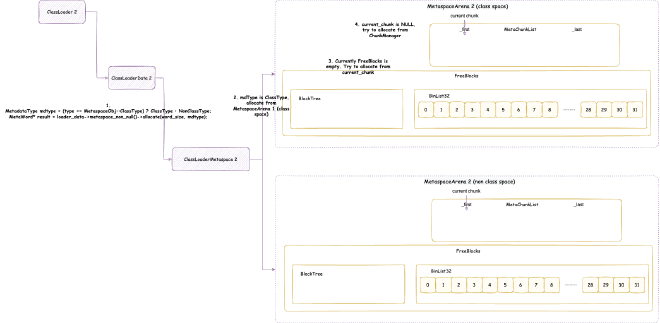
1-2. First, class loader 2 allocates space from its private ClassLoaderData. Since this is for class metaspace, it allocates from the private class metaspace MetaspaceArena.
Search
FreeBlocksfor available space, but this is the first allocation, so there’s definitely none.Try allocating from
_current_chunk, but since this is the first allocation,_current_chunkisNULL.
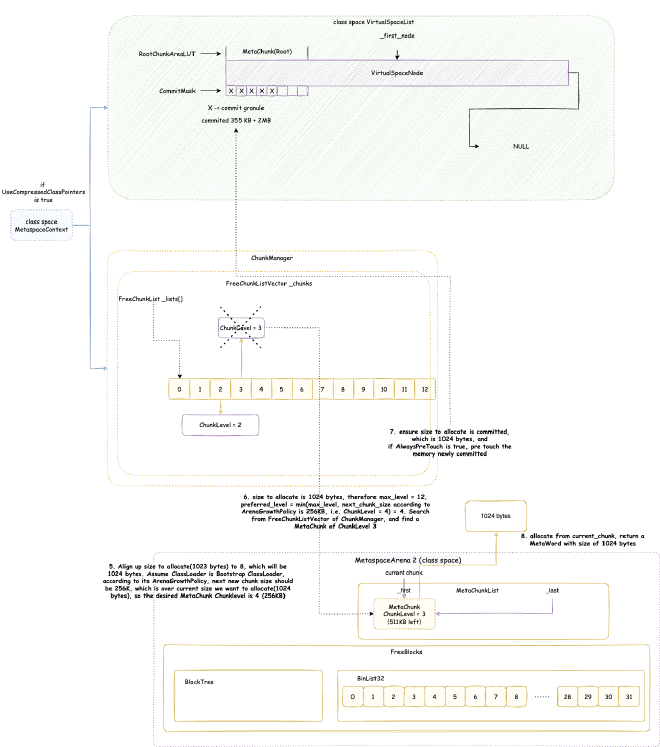
Align the memory to allocate (1023 bytes) to 8 bytes, i.e., 1024 bytes. The minimum
ChunkLevelgreater than or equal to it is 12, somax_level = 12. Assuming this class loader isBootstrap ClassLoader(doesn’t matter what it is, we mainly want to find a correspondingArenaGrowthPolicy). According toArenaGrowthPolicy, the nextMeataChunkto request is256KB, corresponding toChunkLevel4.preferred_levelis the smaller betweenmax_leveland this, which is 4.First search
ChunkManager’sFreeChunkListVectorfor suitable ones. Find the previously placedChunkLevel3. Remove it as_current_chunk.Commit the memory size to allocate. If
AlwaysPreTouchis enabled, perform pre-touch as we analyzed for Java heap memory earlier.Allocate memory from
_current_chunk, allocation succeeds.
4.4.7. Then Class Loader 1 Gets Recycled by GC#
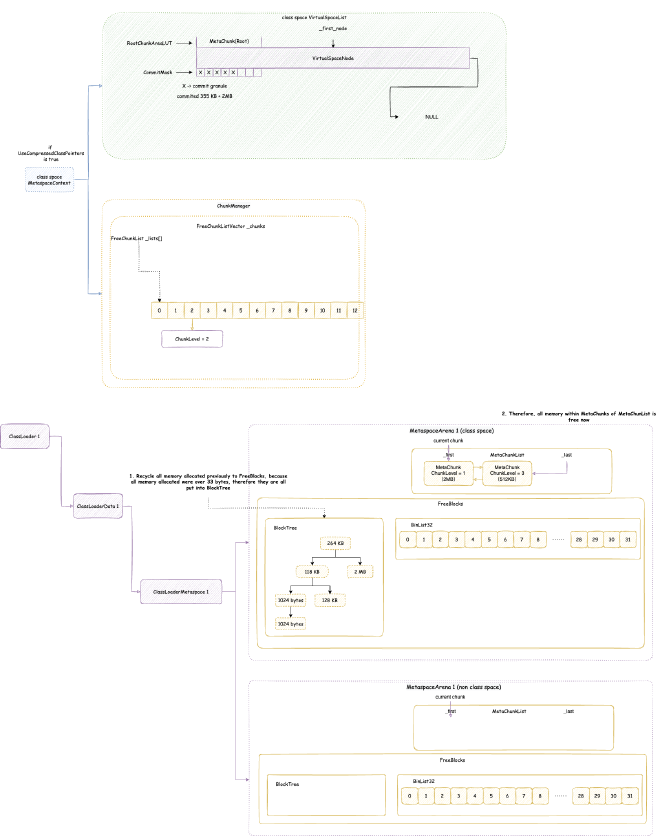
Place all space consumed by class loader 1 back into
FreeBlocks. Previously allocated 1024 bytes, 1024 bytes, 264KB, 2MB, and 128KB. This time place back intoBlockTree.BlockTreepreviously had a remaining 118KB. Overall as shown in the diagram.This way, all memory in
MetaChunks originally managed byMetaspaceArena’sMetaChunkListbecomes free.
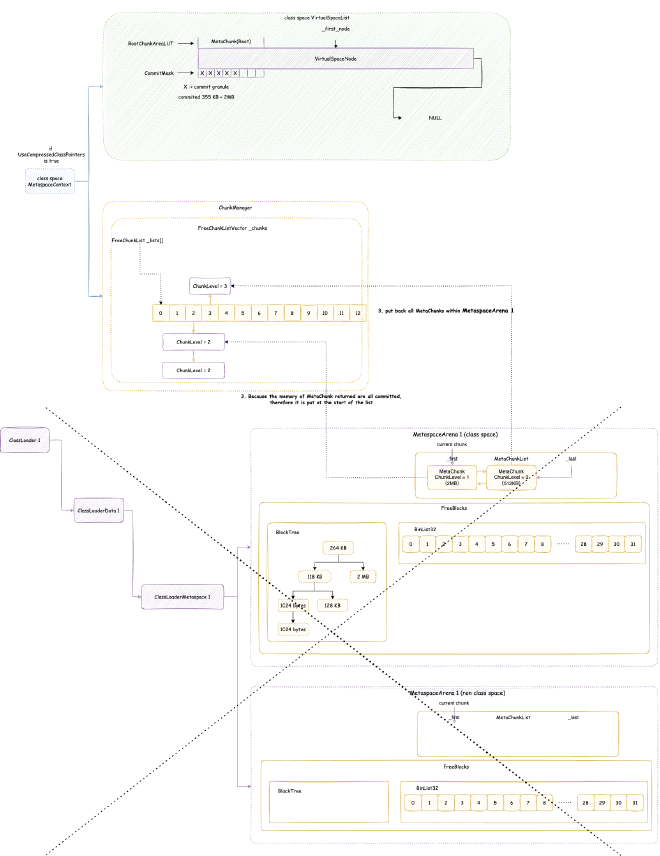
- Place
MetaChunks managed byMetaChunkListback into globalChunkManager’sFreeChunkListVector. All returned ones have committed memory, so they’re placed at the head of eachChunkLevel’s correspondingMetaChunklinked list.
4.4.8. Then Class Loader 2 Needs to Allocate 1 MB for Class Space#

1-2. First, class loader 2 allocates space from its private ClassLoaderData. Since this is for class metaspace, it allocates from the private class metaspace MetaspaceArena.
Search
FreeBlocksfor available space, still none currently.Try allocating from
_current_chunk, insufficient space. And_current_chunkisn’t aleader, so don’t try expansion.
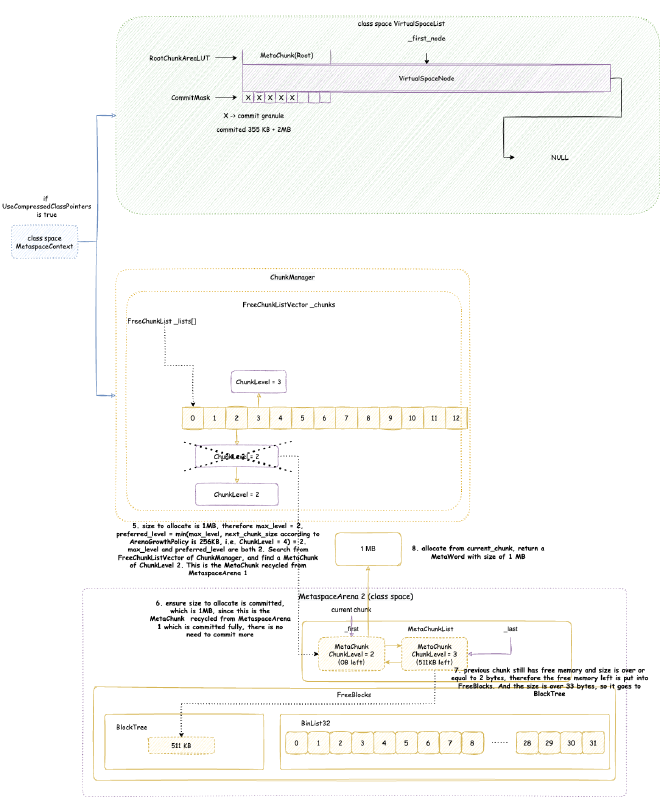
Align the memory to allocate (1MB) to 8 bytes, i.e., 1MB. The size to allocate is 1MB, with minimum
ChunkLevelgreater than or equal to it being 2, somax_level = 2. According toArenaGrowthPolicy, the nextMeataChunkto request is256KB, corresponding toChunkLevel4.preferred_levelis the smaller betweenmax_leveland this, which is 2. SearchFreeChunkListVectorand find a suitable one, use it ascurrent_chunkfor allocation. This is actually recycled from class loader 1 earlier.Since it’s recycled from earlier, the memory inside is already
committed, so no need to commit here.The previous
current_chunk’s remaining space is greater than 2 bytes, so it needs to be recycled toFreeBlocks. Since it’s greater than 33 bytes, it goes intoBlockTree.Allocate memory from
_current_chunk, allocation succeeds.
4.5. Metaspace Size Limits and Dynamic Adjustment#
We haven’t mentioned how to limit metaspace size earlier. Actually, it’s limiting committed memory size. Metaspace limits aren’t just restricted by our parameter configurations. As mentioned earlier, metaspace memory recycling is also quite special - metaspace memory is basically requested and managed by each class loader’s ClassLoaderData, and when class loaders are recycled by GC, the metaspace managed by ClassLoaderData is also recycled. So GC can trigger recycling of some metaspace. Therefore, when designing metaspace, there’s also a dynamic limit _capacity_until_GC, i.e., the metaspace usage size that triggers GC. When space to be allocated causes overall metaspace usage to exceed this limit, GC is attempted. This dynamic limit is also dynamically expanded or contracted during each GC.
Let’s first review the previously mentioned parameter configurations:
MetaspaceSize: Initial metaspace size, also minimum metaspace size. During subsequent metaspace size adjustments, it won’t go below this size. Default is 21M.MaxMetaspaceSize: Maximum metaspace size, default is unsigned int maximum value.MinMetaspaceExpansion: Minimum change size during each metaspace size adjustment. Default is 256K.MaxMetaspaceExpansion: Maximum change size during each metaspace size adjustment. Default is 4M.MaxMetaspaceFreeRatio: Maximum metaspace free ratio, default is 70 (70%).MinMetaspaceFreeRatio: Minimum metaspace free ratio, default is 40 (40%).
4.5.1. CommitLimiter Limits Metaspace Committable Memory Size and Determines When to Attempt GC#
CommitLimiter is a global singleton used to limit metaspace committable memory size. Every time metaspace commits memory for allocation, it calls CommitLimiter::possible_expansion_words method, which checks:
- Whether current metaspace committed memory size plus size to allocate exceeds
MaxMetaspaceSize - Whether current metaspace committed memory size plus size to allocate exceeds
_capacity_until_GC; if so, attempt GC
The core logic for attempting GC is:
- Retry allocation
- If allocation still fails, check if
GCLockeris locked prohibiting GC. If so, first try increasing_capacity_until_GCfor allocation. If allocation succeeds, return directly; otherwise, block waiting forGCLockerrelease. - If not locked, attempt triggering GC, then return to step 1 (there’s a small parameter
QueuedAllocationWarningCount; if GC trigger attempts exceed this count, a warning log is printed, thoughQueuedAllocationWarningCountdefaults to 0 so no printing occurs, and the probability of multiple GC triggers being unable to satisfy is quite low)
4.5.2. After Each GC, Recalculate _capacity_until_GC#
During JVM initialization, _capacity_until_GC is first set to MaxMetaspaceSize because JVM initialization loads many classes and should avoid triggering GC. After initialization, _capacity_until_GC is set to the larger value between current metaspace usage size and MetaspaceSize. Also, a _shrink_factor is initialized, mainly used for the proportion of each shrinkage if metaspace size needs to be reduced.
After that, after each GC recycling, a new _capacity_until_GC needs to be recalculated:
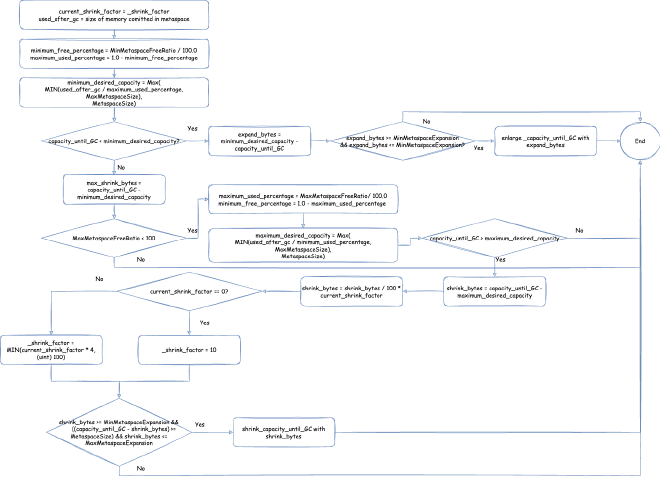
- Read
crrent_shrink_factor = _shrink_factor, count current metaspace used spaceused_after_gc. - First check if expansion is needed:
- First use
MinMetaspaceFreeRatiominimum metaspace free ratio to calculateminimum_free_percentageandmaximum_used_percentage, check if expansion is needed. - Calculate current metaspace minimum required size
minimum_desired_capacity: use current metaspace used spaceused_after_gcdivided bymaximum_used_percentage, ensuring it’s not less than initial metaspace sizeMetaspaceSizeand not greater than maximum metaspace sizeMaxMetaspaceSize. - If current
_capacity_until_GCis less than calculated current metaspace minimum required sizeminimum_desired_capacity, check if expansion space is greater than or equal to configuredMinMetaspaceExpansionand less than or equal toMaxMetaspaceExpansion. Only expand if satisfied. - Expansion actually means increasing
_capacity_until_GC
- First use
- Then check if contraction is needed:
- Use
MaxMetaspaceFreeRatiomaximum metaspace free ratio to calculateminimum_free_percentageandmaximum_used_percentage, check if contraction is needed. - Calculate current metaspace minimum required size
maximum_desired_capacity: use current metaspace used spaceused_after_gcdivided bymaximum_used_percentage, ensuring it’s not less than initial metaspace sizeMetaspaceSizeand not greater than maximum metaspace sizeMaxMetaspaceSize. - If current
_capacity_until_GCis greater than calculated current metaspace minimum required sizemaximum_desired_capacity, calculateshrink_bytes=_capacity_until_GCminusmaximum_desired_capacity. _shrink_factorstarts at 0, then becomes 10%, then quadruples each time until 100%. Expansion size isshrink_bytestimes this percentage.- If contraction is greater than or equal to configured
MinMetaspaceExpansionand less than or equal toMaxMetaspaceExpansion, and contraction won’t go below initial metaspace sizeMetaspaceSize, then contract. - Contraction actually means decreasing
_capacity_until_GC
- Use
We can see that if we set MinMetaspaceFreeRatio to 0, there will be no expansion, and if we set MaxMetaspaceFreeRatio to 100, there will be no contraction. The _capacity_until_GC value won’t change due to GC operations.
4.6. Metaspace Analysis with jcmd VM.metaspace, JVM Logs, and JFR Events#
4.6.1. Understanding jcmd <pid> VM.metaspace Output#
The jcmd <pid> VM.metaspace command provides detailed information about the current metaspace usage for a specific JVM process. The output includes:
1. Metaspace Usage Statistics from MetaChunk Perspective
Total Usage - 1383 loaders, 33006 classes (1361 shared):
  Non-Class: 7964 chunks,    150.83 MB capacity,  150.77 MB (>99%) committed,   150.21 MB (>99%) used,   562.77 KB ( <1%) free,     6.65 KB ( <1%) waste , deallocated: 869 blocks with 249.52 KB
  Class: 2546 chunks,     21.00 MB capacity,   20.93 MB (>99%) committed,    20.21 MB ( 96%) used,   741.42 KB (  3%) free,   216 bytes ( <1%) waste , deallocated: 1057 blocks with 264.88 KB
  Both: 10510 chunks,   171.83 MB capacity,  171.70 MB (>99%) committed,   170.42 MB (>99%) used,     1.27 MB ( <1%) free,     6.86 KB ( <1%) waste , deallocated: 1926 blocks with 514.41 KB
This shows:
- A total of 1383 class loaders have loaded 33006 classes (1361 of which are shared classes).
- Capacity refers to the total capacity of MetaChunks (Reserved memory); committed indicates the actual committed memory size within these MetaChunks, representing actual physical memory usage; used shows the actual utilized size within MetaChunks, which is always smaller than committed; free represents remaining available space; committed = used + free + waste; deallocated refers to memory recovered to FreeBlocks; waste represents wasted space due to allocation inefficiencies.
- Non-Class metaspace usage: 7964 MetaChunks with total capacity of 150.83 MB, currently committed 150.77 MB, used 150.21 MB, with 562.77 KB remaining and 6.65 KB wasted. FreeBlocks currently contain 869 recovered blocks totaling 249.52 KB.
- Class metaspace usage: 2546 MetaChunks with total capacity of 21.00 MB, currently committed 20.93 MB, used 20.21 MB, with 741.42 KB remaining and 216 bytes wasted. FreeBlocks currently contain 1057 recovered blocks totaling 264.88 KB.
- Total metaspace usage: 10510 MetaChunks with total capacity of 171.83 MB, currently committed 171.70 MB, used 170.42 MB, with 1.27 MB remaining and 6.86 KB wasted. FreeBlocks currently contain 1926 recovered blocks totaling 514.41 KB.
Virtual Space Information:
Virtual space:
  Non-class space:      152.00 MB reserved,     150.81 MB (>99%) committed,  19 nodes.
      Class space:        1.00 GB reserved,      20.94 MB (  2%) committed,  1 nodes.
             Both:        1.15 GB reserved,     171.75 MB ( 15%) committed.
This indicates:
- Non-class metaspace VirtualSpaceList: Reserved 152.00 MB total, committed 150.81 MB, with 19 VirtualSpaceNodes.
- Class metaspace VirtualSpaceList: Reserved 1.00 GB total, committed 20.94 MB, with 1 VirtualSpaceNode.
- Total metaspace VirtualSpaceList: Reserved 1.15 GB total, committed 171.75 MB.
Chunk Freelists Information:
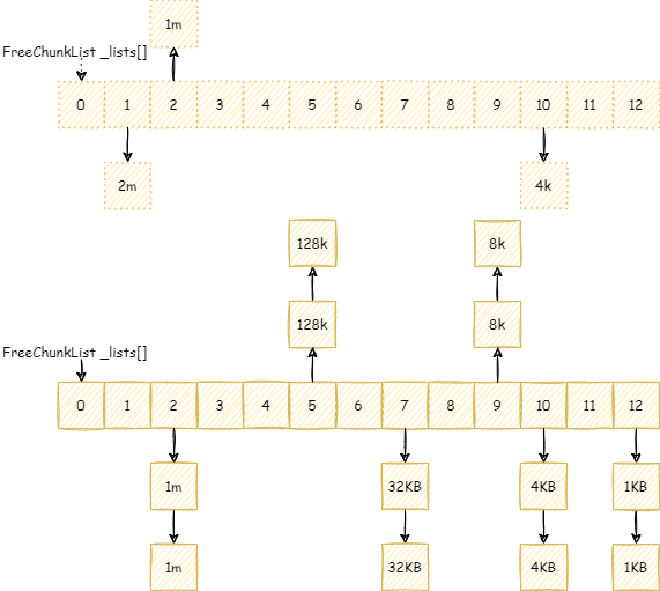
Waste and Statistics:
Waste (unused committed space):(percentages refer to total committed size 171.75 MB):
        Waste in chunks in use:      6.86 KB ( <1%)
        Free in chunks in use:      1.27 MB ( <1%)
                In free chunks:      0 bytes (  0%)
Deallocated from chunks in use:    514.41 KB ( <1%) (1926 blocks)
                       -total-:      1.78 MB (  1%)

chunk header pool: 10520 items, 748.30 KB.
Internal Statistics:
Internal statistics:

num_allocs_failed_limit: 24.
num_arena_births: 2768.
num_arena_deaths: 2.
num_vsnodes_births: 20.
num_vsnodes_deaths: 0.
num_space_committed: 2746.
num_space_uncommitted: 0.
num_chunks_returned_to_freelist: 28.
num_chunks_taken_from_freelist: 10515.
num_chunk_merges: 9.
num_chunk_splits: 6610.
num_chunks_enlarged: 4139.
num_purges: 2.
num_inconsistent_stats: 0.
Configuration Settings:
Settings:
MaxMetaspaceSize: unlimited
CompressedClassSpaceSize: 1.00 GB
Initial GC threshold: 40.00 MB
Current GC threshold: 210.12 MB
CDS: on
MetaspaceReclaimPolicy: balanced
 - commit_granule_bytes: 65536.
 - commit_granule_words: 8192.
 - virtual_space_node_default_size: 1048576.
 - enlarge_chunks_in_place: 1.
 - new_chunks_are_fully_committed: 0.
 - uncommit_free_chunks: 1.
 - use_allocation_guard: 0.
 - handle_deallocations: 1.
4.6.2. Metaspace-Related JVM Logs#
Using the startup parameter -Xlog:metaspace*=debug::utctime,level,tags, we can view metaspace-related JVM logs.
During JVM metaspace initialization, basic parameters are output:
[2023-04-11T09:07:31.994+0000][info][metaspace] Initialized with strategy: balanced reclaim.
[2023-04-11T09:07:31.994+0000][info][metaspace]  - commit_granule_bytes: 65536.
[2023-04-11T09:07:31.994+0000][info][metaspace]  - commit_granule_words: 8192.
[2023-04-11T09:07:31.994+0000][info][metaspace]  - virtual_space_node_default_size: 1048576.
[2023-04-11T09:07:31.994+0000][info][metaspace]  - enlarge_chunks_in_place: 1.
[2023-04-11T09:07:31.994+0000][info][metaspace]  - new_chunks_are_fully_committed: 0.
[2023-04-11T09:07:31.994+0000][info][metaspace]  - uncommit_free_chunks: 1.
4.6.3. Metaspace JFR Events#
4.6.3.1. jdk.MetaspaceSummary - Periodic Metaspace Statistics#
This event includes properties such as:
- Event start time
- GC Identifier
- When (Before GC/After GC)
- GC Threshold
- Class/Data/Total Reserved/Committed/Used values
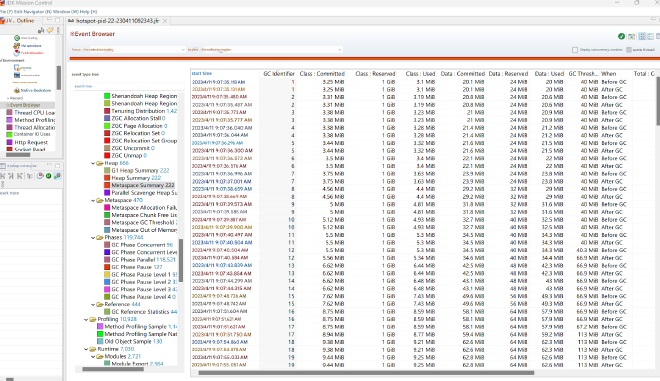
4.6.3.2. jdk.MetaspaceAllocationFailure - Metaspace Allocation Failure#
This event is triggered when regular allocation fails and includes:
- Event start time
- Class loader information
- Metadata type
- Metaspace object type
- Allocation size
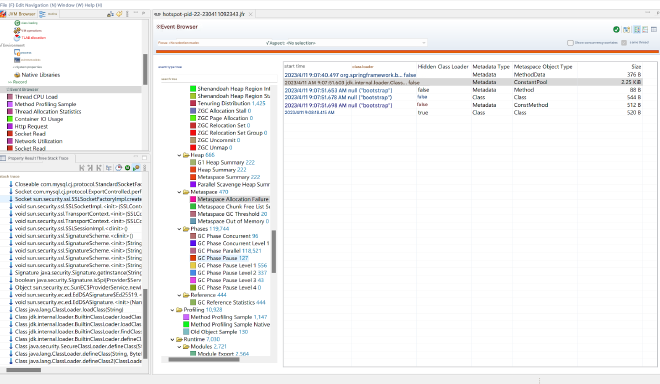
4.6.3.3. jdk.MetaspaceOOM - Metaspace Out of Memory#
Triggered during metaspace OOM conditions with similar properties to allocation failure events.
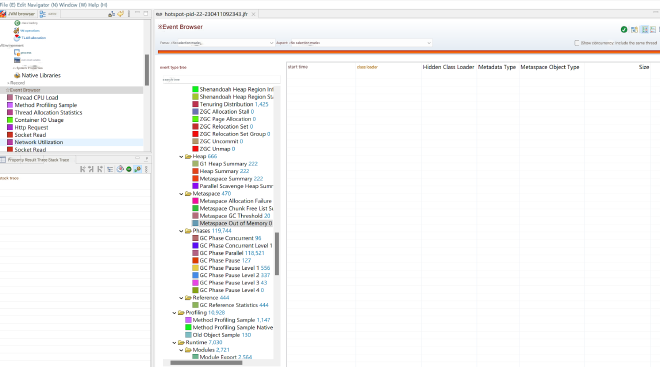
4.6.3.4. jdk.MetaspaceGCThreshold - GC Threshold Changes#
Records changes to the metaspace GC threshold with:
- New and old threshold values
- Updater mechanism (expand_and_allocate or compute_new_size)
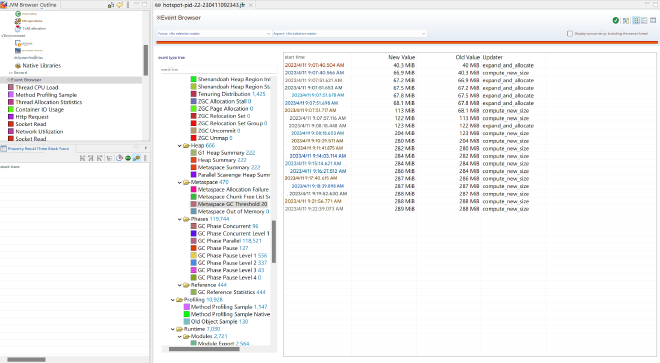
4.6.3.5. jdk.MetaspaceChunkFreeListSummary - Chunk FreeList Statistics#
This event was introduced with JEP 387: Elastic Metaspace but currently shows all zeros as it’s not yet fully implemented.
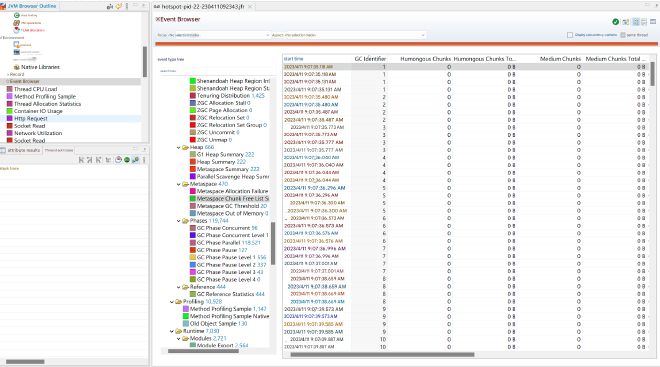
5. JVM Thread Memory Design (Focus on Java Threads)#
While Java 19 introduced virtual threads as a preview feature, our discussion focuses on traditional thread memory structures, as virtual threads don’t significantly change the underlying memory architecture.
JVM thread memory consists of two main components: thread stack memory and thread data structure memory.
5.1. Types of JVM Threads and Stack Parameters#
JVM contains several types of threads:
- VM Thread: Unique global thread executing VM Operations
- GC Threads: Responsible for garbage collection operations
- Java Threads: Including application threads and internal service threads
- Compiler Threads: JIT compiler threads (C1 and C2)
- Periodic Task Clock Thread: Global watcher thread for timing and periodic tasks
- Async Log Thread: Handles asynchronous JVM logging (Java 17+)
- JFR Sampling Thread: Collects JFR sampling events
Key Parameters:
ThreadStackSize(or-Xss): Java thread stack size- Linux x86: 1024 KB default
- Linux aarch64: 2048 KB default
- Windows: Uses OS default (1024KB for 64-bit)
VMThreadStackSize: Stack size for VM, GC, and other internal threadsCompilerThreadStackSize: Compiler thread stack sizeStackYellowPages: Yellow zone page countStackRedPages: Red zone page countStackShadowPages: Shadow zone page countStackReservedPages: Reserved zone page count
5.2. Java Thread Stack Memory Structure#
Java thread stacks contain both Java Virtual Machine stack frames and Native method stack frames. The structure accommodates different execution modes:
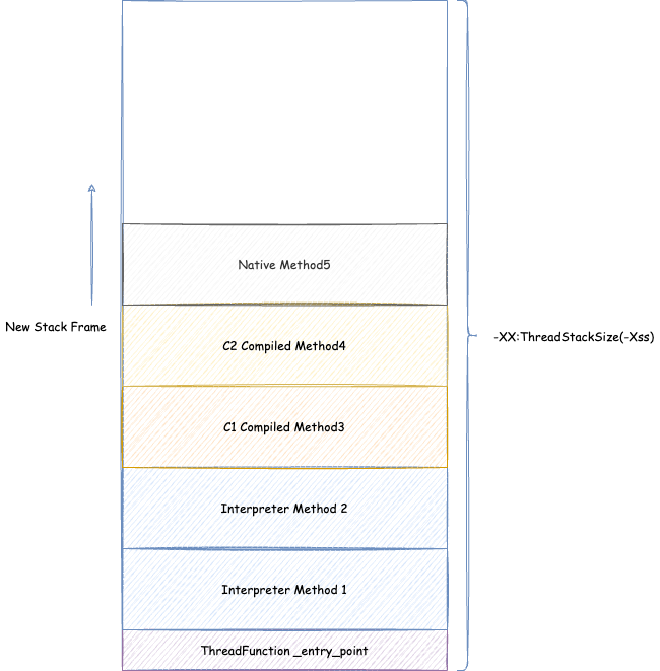
This diagram shows a thread executing through various stages: interpreted execution (methods 1-2), C1-compiled execution (method 3), C2-compiled execution (method 4), and native method calls (method 5).
5.3. How Java Threads Throw StackOverflowError#
JVM thread memory includes special protection zones:

Protection Zones:
Yellow Zone: Controlled by
-XX:StackYellowPages. When stack expansion reaches this zone, aSIGSEGVoccurs, triggeringStackOverflowError. The yellow pages are temporarily mapped to provide space for exception handling.Red Zone: Controlled by
-XX:StackRedPages. Reserved for critical JVM error handling and logging tohs_err_pid.logfiles.Reserved Zone: Controlled by
-XX:StackReservedPages. Introduced in Java 9 (JEP 270) to protect critical sections (likeReentrantLock) from inconsistent states duringStackOverflowError.Shadow Zone: Controlled by
-XX:StackShadowPages. An abstract zone that follows the current stack frame, used to ensure native calls don’t cause stack overflow by assuming native methods won’t exceed this size.
5.3.1. Stack Overflow Detection in Interpreted vs Compiled Execution#
Interpreted Execution performs method-by-method checking before each call, comparing the required frame size against available space.
Compiled Execution uses optimized stack bang operations:
- For frames smaller than one page: Only check if native calls would exceed shadow zone
- For frames larger than one page: Perform page-by-page verification to ensure no memory corruption
5.3.2. Minimum Java Thread Stack Size#
For Linux x86 (4K pages), minimum requirements include:
- Protection zones: 4 pages (Yellow: 2, Red: 1, Reserved: 1)
- Shadow zone: 20 pages
- Minimum thread allowance: 40K
Total minimum: 96K + 40K = 136K
Testing confirms this limit:
$ java -Xss1k
The Java thread stack size specified is too small. Specify at least 136k
Error: Could not create the Java Virtual Machine.