Solving JVM Safepoint Delays: A Journey from EFS Integration to Async Logging#
Recently, we upgraded to Java 17, and our k8s operations team made an optimization to centralize application log collection. They configured all our pods (think of them as individual Java microservice processes) to have their JVM logs collected into a unified AWS EFS service (Elastic File System - essentially NFS + S3 object storage cluster under the hood). Our JVM logging configuration includes several key components:
- GC logs:
-Xlog:gc*=debug:file=${LOG_PATH}/gc%t.log:utctime,level,tags:filecount=50,filesize=100M - JIT compilation logs:
-Xlog:jit+compilation=info:file=${LOG_PATH}/jit_compile%t.log:utctime,level,tags:filecount=10,filesize=10M - Safepoint logs:
-Xlog:safepoint=trace:file=${LOG_PATH}/safepoint%t.log:utctime,level,tags:filecount=10,filesize=10M - Disabled stack trace omission: This only affects internal JDK exceptions like NullPointerException:
-XX:-OmitStackTraceInFastThrow(we’ve already optimized our application to handle performance pressure from excessive stack trace output during high error volumes)
After implementing these changes, we encountered a peculiar issue with three distinct manifestations, all sharing one common symptom: extremely prolonged safepoint durations.
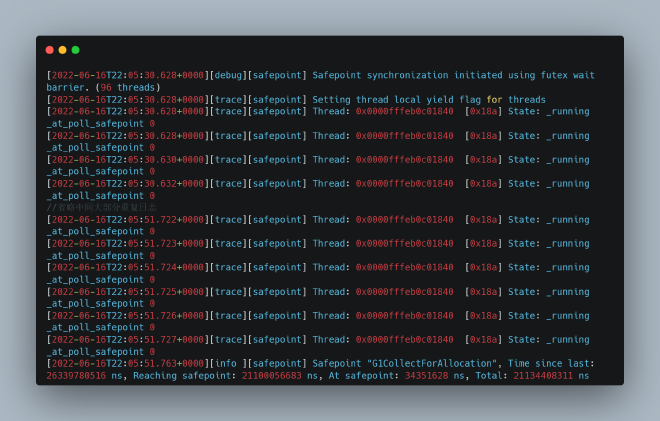
1. Safepoint logs revealed exceptionally long wait times for all threads to reach safepoint (Reaching safepoint: 25+ seconds)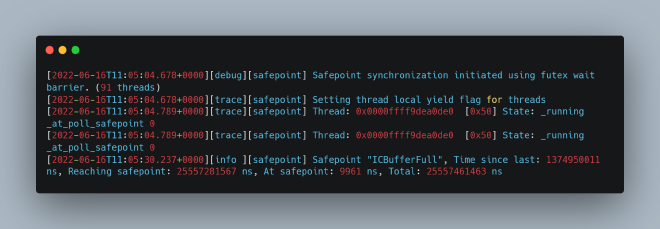
2. Safepoint logs showed extended time spent at safepoint due to GC (At safepoint: 37+ seconds)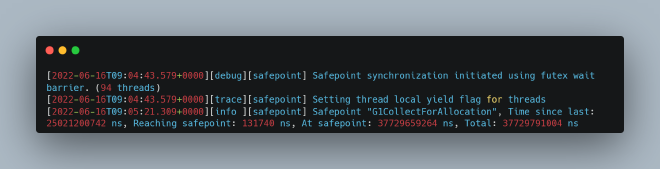
Looking at the GC logs, there was a significant gap between Heap before GC invocations and the heap structure output: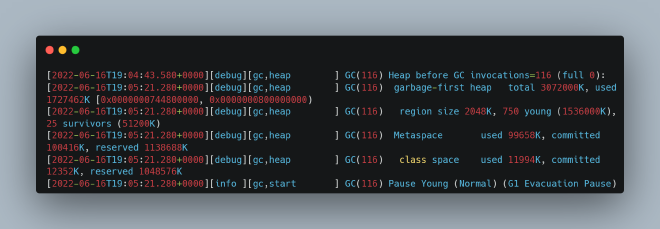
3. Another instance of prolonged safepoint time due to GC, but with gaps in different log locations (29+ seconds)
The GC logs showed substantial intervals between heap structure outputs: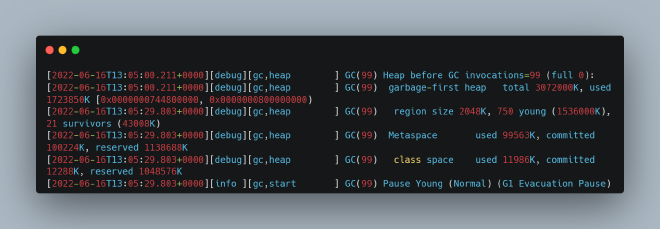
Problem Investigation#
When Java application threads are collectively in safepoint, they’re essentially frozen - unable to perform any operations. This means monitoring that relies on application threads (external JVM monitoring like Spring Actuator’s Prometheus endpoints or Skywalking instrumentation) becomes blind, only showing that methods called during safepoint appear to take an unusually long time, when in reality these methods aren’t the actual bottleneck.
The solution requires internal JVM thread monitoring mechanisms, such as JVM logs and JFR (Java Flight Recording). We also utilized async_profiler (https://github.com/jvm-profiling-tools/async-profiler/) because we noticed that during problematic periods, the process’s CPU usage (not the machine’s, but specifically this process) would spike dramatically:
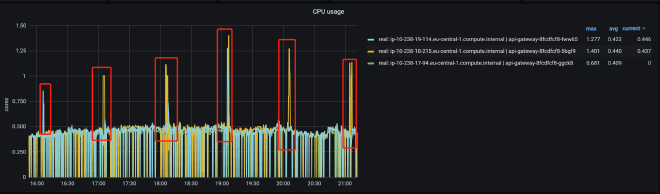
Curiously, when examining CPU usage through async_profiler during the problematic timeframes, we found that apart from expected activity:
During safepoint periods, logging appeared to be interrupted - a highly unusual occurrence. Here’s why this observation is significant:
For the first phenomenon (extended wait for all threads to enter safepoint), we’d typically expect continuous output showing which threads haven’t entered safepoint, as evidenced in the JVM source code:
https://github.com/openjdk/jdk/blob/master/src/hotspot/share/runtime/safepoint.cpp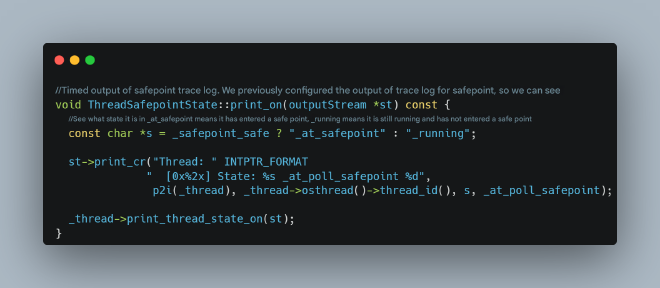
However, in our first scenario, we didn’t see any logs indicating which specific thread was causing the delay.
For the second phenomenon, JFR didn’t reveal any particularly time-consuming GC phases: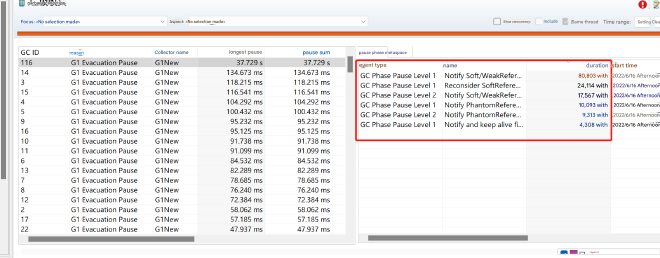
For the third phenomenon, examining the JVM source code revealed that between the two logs with significant gaps, virtually nothing happens except logging itself. Additionally, all problematic incidents occurred around the 05-minute mark of each hour. Upon consulting our operations team, we learned this coincides with hourly log file rotation and EFS synchronization (we generate one log file per hour), involving substantial file I/O (given the underlying cloud service architecture, this might involve EFS NFS or network object storage rather than traditional disk I/O). Could excessive file I/O be blocking JVM log output and consequently freezing the entire JVM?
Why would JVM log output block all application threads? If a JVM thread gets stuck outputting logs outside of safepoint, it would only affect itself, not all application threads. However, during safepoint, all application threads are already paused. If a JVM thread becomes blocked on log output at this time, it could prevent threads from entering safepoint or cause prolonged safepoint duration. For the first phenomenon, a thread outputting JVM logs (not application logs - application log output typically involves native file I/O calls, which are considered to be in safepoint and wouldn’t cause issues) gets stuck, preventing that thread from entering safepoint. For phenomena two and three, GC threads get stuck outputting JVM logs, preventing GC completion.
Let’s first examine the JVM source code to confirm whether blocked JVM log output can indeed freeze the JVM.
JVM Log Output Source Code Analysis#
We’re using Java 17, which didn’t have asynchronous JVM log output before this version. So in the following source code analysis, please ignore async logging code - this represents pre-Java 17 log output behavior:
https://github.com/openjdk/jdk/blob/master/src/hotspot/share/logging/logFileStreamOutput.cpp
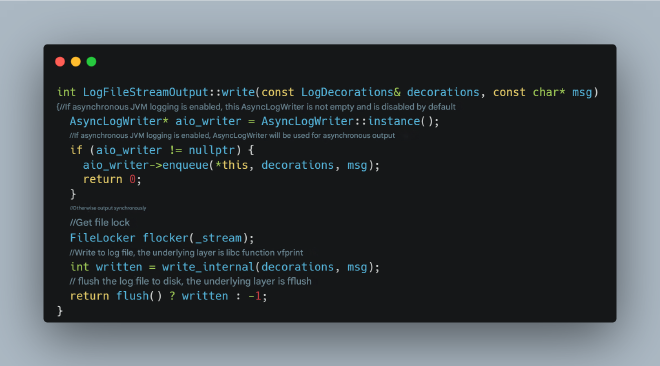
This code clearly shows that if file I/O output gets stuck, the flush operation will block. Additionally, there would be brief CPU spikes, as the flushing wait strategy likely involves CPU spinning for a period before entering a blocked state.
What about switching to async logging? What parameters are available? JVM async logging was introduced in Java 17, corresponding to this issue: https://bugs.openjdk.org/browse/JDK-8229517. The key lies in these two parameters: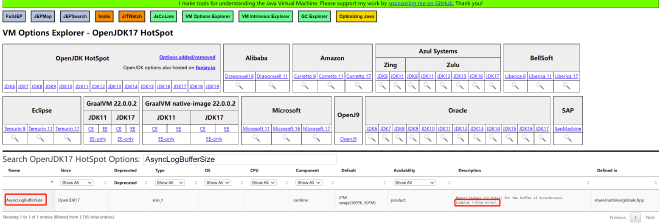
Enable JVM async logging with -Xlog:async and specify async log buffer size with -XX:AsyncLogBufferSize= (default is 2097152, or 2MB). The async logging principle works as follows:
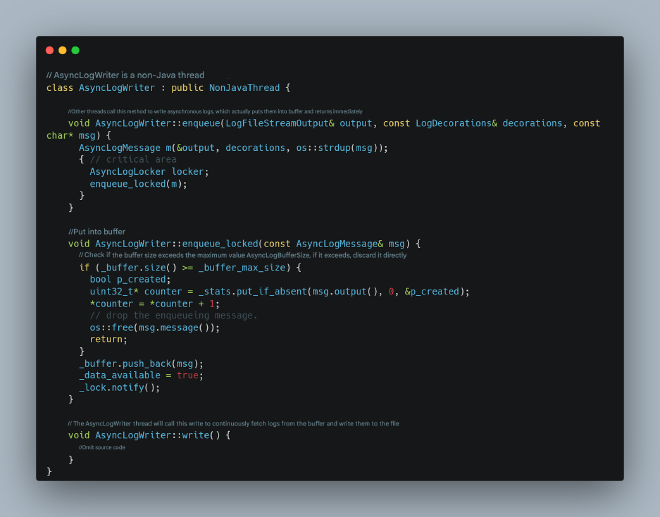
Switching to Async Logging: Significant Improvement but Not Complete Resolution#
We modified our logging to async mode by adding startup parameters: -Xlog:async and -XX:AsyncLogBufferSize=4194304. After observation, the problem was significantly alleviated:

However, one instance still experienced an issue, but the symptoms were different from before. Safepoint logs showed a thread continuously running and refusing to enter safepoint:
What was this thread doing? We used jstack to identify it:
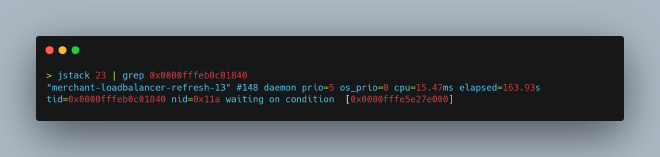
This was a thread responsible for periodically refreshing the microservice instance list, and the code wasn’t using WebFlux properly:
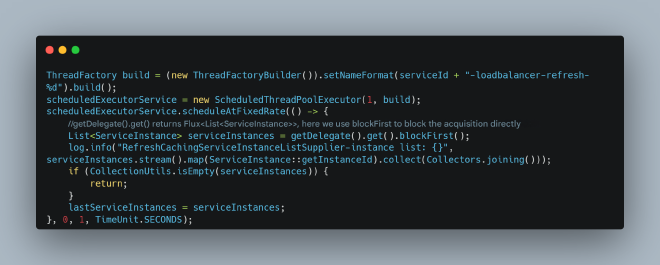
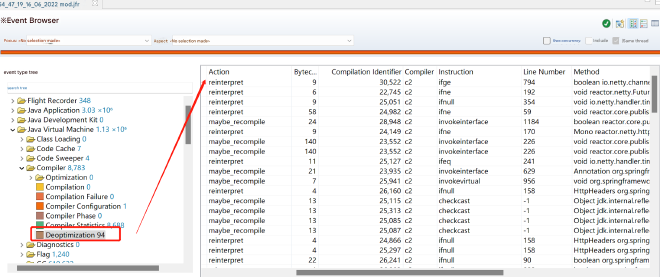
This improper use of async code could lead to JIT optimization errors (correct usage is called frequently, and this incorrect usage is also called frequently, causing continuous JIT C2 optimization and deoptimization). JFR revealed numerous JIT deoptimizations during this period:
This could cause safepoint gaps leading to I/O continuously spinning and waiting for extended periods. The solution was to implement the correct usage pattern:
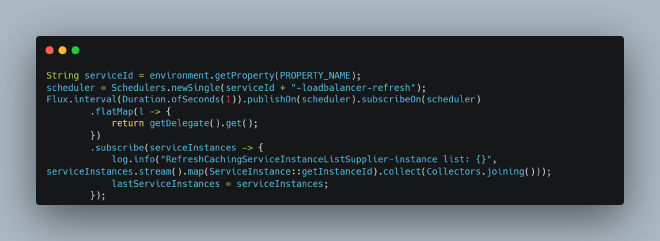
After making this correction, the issue of threads refusing to enter safepoint disappeared completely.