
Java Memory Efficiency: Moving Collectors, Heap Knobs, and Profiling First#
A Java process holding several gigabytes of heap in Task Manager is often labeled “bloated.” Shift the lens from absolute gigabytes to CPU cycles spent on memory management, and the picture changes: the default-path G1 and optional ZGC in the JDK are both moving collectors—they deliberately trade more RAM for lower memory-management CPU overhead. In Inside Java Podcast 59, Oracle Java architect Ron Pressler frames this trade-off as “using RAM chips as program accelerators”; GPU acceleration gets praise while RAM acceleration gets called bloated (speaker’s view). The sections below unpack the mechanics by platform-design theme; quantitative economics and cloud-sizing experience are labeled by source boundary; GC algorithm details follow official JEPs and HotSpot source.
Moving garbage collection: trading RAM for CPU#
Why#
Manual malloc/free, reference counting, and non-moving mark-sweep all pay continuously to “reuse an address”: freeing, coalescing free blocks, fighting fragmentation. Moving collectors take a different path—during compaction they relocate live objects into contiguous regions, and space occupied by dead objects can be overwritten directly on subsequent allocation, so the allocation side advances almost linearly. In his 1987 paper Garbage collection can be faster than stack allocation, Andrew W. Appel argued that under certain conditions GC can be faster than stack allocation; Ron cites this work to show that moving collectors are not an “after-the-fact patch” but an algorithmic choice to reduce memory-management CPU overhead (“RAM as accelerator” is the speaker’s summary, not the paper’s wording).
JEP 333 describes ZGC as a compacting collector that reclaims memory through object relocation; JEP 248 made G1 the server default from JDK 9 onward. By contrast, the removed CMS (JEP 291 deprecated it; JDK 14 removed it) is explicitly no support for compaction in JEP 333 Alternatives—a different design space from the moving route. The official reason for removing CMS is lack of maintainers and availability of G1/ZGC/Shenandoah replacements (speaker’s view: the moving route is overall superior—Ron’s summary, not JEP 363’s text).
Mechanism and constraints#
| Dimension | Moving (G1 / ZGC) | Non-moving (e.g. CMS, Go mark-sweep) |
|---|---|---|
| RAM | Higher: retains garbage, reserves compaction space | Usually lower |
| Memory-management CPU | Tunable via heap size; tends lower | free/fragmentation costs more direct |
| Ops knobs | -Xmx and other heap bounds ≈ “memory knob” | Speaker’s view: lacks equivalent knobs |
Even with the knob turned toward “save memory as much as possible,” a moving collector may still use more RAM than a non-moving design, but gains higher throughput (speaker’s view). Economically, RAM is usually cheaper than CPU; Ron gives an order-of-magnitude “10× more RAM for 5% CPU” in a JavaOne companion talk (not repeated in this podcast; figure not independently verified).
G1 and ZGC should not be conflated: JEP 189 states G1 performs evacuation but does not do concurrent evacuation; ZGC’s concurrent relocation is a different tier of implementation. On JDK 27, JEP 523 proposes making G1 the default GC for all environments (Integrated), continuing the moving main path.
How to#
Selection and migration: -XX:+UseConcMarkSweepGC is ignored on JDK 14+ and falls back to the default GC (JEP 363). Prefer G1 for new deployments; evaluate ZGC for low-latency scenarios (JDK 15 GA, JEP 377). No API-level breaking change—the impact is on the operations side.
# View current GC (JDK 9+)
java -XX:+PrintFlagsFinal -version 2>&1 | grep Use.*GC

# Explicitly enable ZGC (example)
java -XX:+UseZGC -Xmx4g -jar app.jar
Common misconceptions#
- Treating “Java uses memory” as an implementation oversight—in the moving model, some RAM is a deliberate trade-off for CPU.
- Equating G1 and ZGC concurrent-moving capabilities—evacuation timing and pause characteristics differ.
- Using JEP 363’s text to prove “moving is necessarily better”—the official wording is about maintainability and alternatives; overall superiority is the architect’s summary.
Whole-machine view: RAM-to-CPU ratio#
Why#
Backend sizing that looks only at “how many GB this pod has” invites misjudgment. Ron defines the key metric as how much RAM per CPU core (speaker’s view), inspired by a keynote from Oracle GC team member Erik Österlund at the SIGPLAN ISMM workshop (specific keynote claims not retrieved for full verification; Österlund’s identity appears under Reviewed by in JEP 377). The intuition: if a process persistently saturates a core’s CPU, almost no other program can use that core’s RAM effectively—“100% CPU + 1% RAM” earns no bonus points (speaker’s view).
Kubernetes Pod resource management describes CPU and memory via request/limit; there is no global hard rule of “at least 1 GB per core.” Ron says the smallest cloud instances commonly offer ≥ 1 GB RAM / core (speaker’s view; cloud vendor SKUs change over time—verify yourself). When Nicolai asks whether Java loses on “few-GB” small instances, Ron says no and stresses RAM/core over absolute GB (specific benchmarks are in the JavaOne talk; the podcast does not provide them).
Mechanism and constraints#
Bottleneck-shift logic: when CPU is scarce, using idle RAM to ease GC and allocation pressure aligns with general performance engineering (consensus discussion). Historically, Java was desktop-heavy and users watched RAM in Task Manager; servers care more about throughput, latency, and cost curves (speaker’s view).
How to#
On K8s or VMs, declare both CPU and memory requests—avoid pressing only a memory limit while CPU saturates:
resources:
  requests:
    cpu: "2"
    memory: "4Gi"
  limits:
    memory: "4Gi"
When pairing with -Xmx, keep the heap cap below the container memory limit to reserve headroom for metaspace, thread stacks, off-heap memory, and GC—the ratio depends on workload; there is no single official formula.
Common misconceptions#
- Comparing Java to Go/Rust by absolute GB alone—ignoring RAM/core and whether the workload is compute-bound.
- Treating Ron’s 1 GB/core as a Kubernetes specification—Kubernetes docs have no such global floor.
- Using
https://www.ismm.org/as the memory-management ISMM—that domain points to a mountain-medicine society; the correct entry is SIGPLAN ISMM.
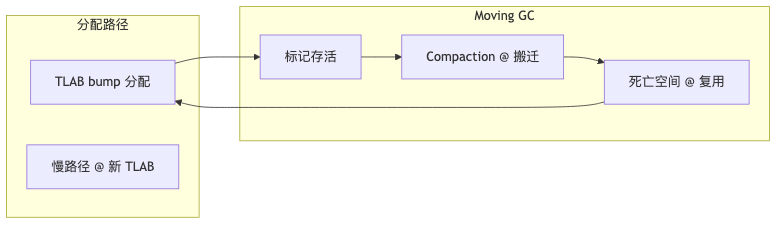
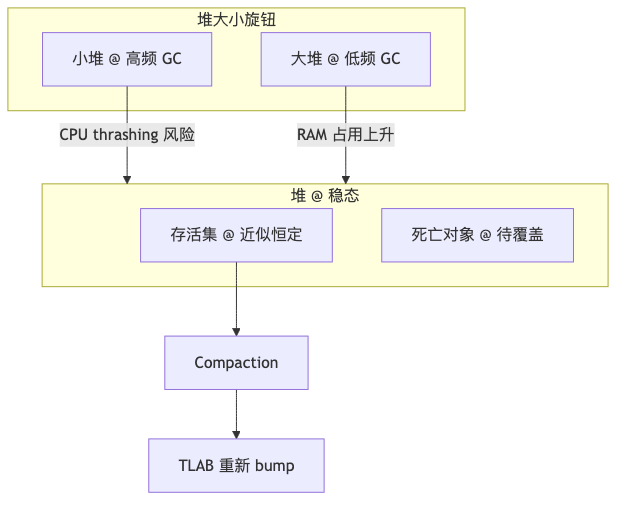
Allocation model: TLAB, compaction, and heap knobs#
Why#
Java heap allocation has no per-object free semantics: threads allocate by advancing a _top pointer inside a ThreadLocalAllocBuffer (TLAB) (inline implementation), approaching linear bump speed; reclamation is batched by GC during compaction. Ron uses roughly constant live object count in steady state as a premise: GC work on the live set is weakly related to garbage volume—the larger the heap, the more can be allocated before fill, so collection frequency is roughly inversely proportional to heap size (idealized steady-state inference; no corresponding JEP). Double the heap and similar preservation work happens about half as often; heap ×10, roughly ten fewer collections—counterexample: heap long-running at 90–99% capacity causing thrashing (general GC experience; HotSpot does not encode that percentage).
Mechanism and constraints#
On the ZGC side, partial “knob” evolution exists: JEP 351’s -XX:ZUncommit can return unused heap to the OS; JEP 377 introduces -XX:SoftMaxHeapSize as a soft cap—not the same as users no longer setting -Xmx. Ron says the GC team is working to eliminate manual heap sizing so the collector decides the optimal heap and users only express “prefer RAM or prefer CPU,” with ZGC possibly leading (speaker’s view; as of 2026-06-10 no GA JEP eliminates -Xmx).
Low-level languages can approximate similar efficiency with arenas (large buffer + internal bump, released in one shot at phase end); Ron says Zig supports this well (speaker’s view). JEP 454’s Arena defines temporal bounds—partial overlap with Zig-style allocators, semantics not fully equivalent.
How to#
Observe allocation and GC frequency, then tune the heap—rather than copying an “industry standard ratio” first:
# JFR at startup; observe allocation and GC (JDK 11+)
java -XX:StartFlightRecording=filename=recording.jfr,duration=120s \
  -Xmx2g -jar app.jar

# Dump while running
jcmd <pid> JFR.dump filename=recording.jfr
Try ZGC soft cap and uncommit (requires JDK 15+; -Xms should not equal -Xmx or ZUncommit is effectively disabled—see JEP 351):
java -XX:+UseZGC -Xmx8g -XX:SoftMaxHeapSize=4g \
  -XX:+ZUncommit -XX:ZUncommitDelay=300 -jar app.jar
Common misconceptions#
- Assuming
SoftMaxHeapSizealready removes manual heap configuration—ergonomics still center on-Xms/-Xmx. - “I can beat GC with my own free logic”—usually means reimplementing a memory manager; expert-grade malloc investment is enormous (Ron cites Stefan Johansson and others, speaker’s view).
- Equating FFM
Arenawith Zig arenas—JEP 454 governs segment lifetime boundaries.
Cross-language comparison: fragmentation, allocators, and no free lunch#
Why#
“C/C++ uses less memory” often comes from micro-benchmarks, not long-running production shapes. Ron notes C/C++ face fragmentation and long-term degradation too: heap behavior after an hour can differ radically from the start (speaker’s view; the Go GC Guide has official description of the non-moving path). C/C++ can switch malloc implementations with effects comparable to switching GC; modern allocators are as complex as GC (speaker’s view).
The Go GC Guide states Go uses a mark-sweep, non-moving GC and pre-allocates address space to limit fragmentation. Analogy to the defunct HotSpot CMS helps intuition, but Go’s concurrent mark-sweep and CMS algorithms are not equivalent (speaker’s view: Go-style path is “similar” to CMS). The non-moving path saves RAM but cannot trade RAM for CPU the way moving collectors can—aligned with the P01 argument direction; quantitative extrapolation remains opinion.
Mechanism and constraints#
At the micro level, cache hit vs miss on the same address can mean roughly 100× latency difference, depending on other threads’ behavior (speaker’s view)—isolated micro-benchmarks rarely extrapolate to whole programs. Experienced C++ programmers may avoid some fragmentation, but complexity spreads across compiler, CPU microarchitecture, and cache layers (speaker’s view).
How to#
Cross-language evaluation should fix workload and observation window, not a single malloc loop:
# Record RSS and CPU time when comparing (example)
/usr/bin/time -l ./native_app
/usr/bin/time -l java -Xmx2g -jar app.jar
At JNI/FFM boundaries, use JEP 454 Arena to define off-heap lifetimes and avoid mixing semantics with JVM GC.
Common misconceptions#
- Extrapolating from equal-size-object malloc/free loops to Java—different object sizes and lifetime distributions invalidate the leap.
- Equating Go non-moving with CMS—the former is still active and implemented differently.
- Ignoring that allocators are long-lived state machines too—switching
mallocimplementation is not “zero-cost engine swap.”

Benchmarks lie: profiling first#
Why#
The performance community often says benchmarks lie (speaker’s view; the JMH README emphasizes pitfalls but does not use that exact phrase)—the problem is often exponential extrapolation fallacy, not fabricated table numbers. Micro-benchmarks that repeatedly malloc/free equal-size objects show C++/Rust matching Java speed with less RAM; on real programs (different sizes, lifetimes) that does not extrapolate (speaker’s view).
Comparative third-party benchmarks (“A faster than B”) are almost useless for programs you did not write; what helps is benchmarking your own code while understanding mechanisms and fast paths. Micro-benchmark relevance has declined overall—compilers can generate very different code for isolated snippets vs whole-program context (speaker’s view).
Mechanism and constraints#
Recommended workflow (speaker’s view):
- Profile the whole program first (JFR, Java Mission Control); find hot paths.
- On hot-path implementations, use JMH to compare candidates.
- Must validate on the whole program again—otherwise you violate Amdahl’s law: optimizing a path that is 1% of time yields at most ~1% overall gain.
JMH reduces pitfalls like dead-code elimination, but a professional veneer can make @Benchmark + tables feel like the finish line; Aleksei Shipilev stresses numbers are a starting point and you need to understand causes (Nicolai paraphrasing, not Shipilev speaking directly). Micro-benchmark blog posts about others’ APIs (e.g. Stream) can be harmful (Ron’s leaning; speaker’s view).
What usually slows Java applications is not stream vs loop—it is wrong algorithms/data structures, excessive synchronization, I/O (databases, etc.)—most information systems are not compute-bound (speaker’s view).
How to#
# Start recording (see java(1) manual)
java -XX:StartFlightRecording=filename=recording.jfr,duration=60s -jar app.jar

# Dump while running (see jcmd(1) manual)
jcmd <pid> JFR.dump filename=recording.jfr

# Text view of hotspots
jfr print --events jdk.ExecutionSample recording.jfr
Run JMH in a standalone Maven/Gradle project; avoid running the main class directly from the IDE (README says results are less reliable).
Common misconceptions#
- Using JMH scores to prove language superiority—conclusions are invalid when extrapolation boundaries are undefined.
- Skipping whole-program validation—misidentified hot paths send optimization in the wrong direction.
- Conflating profiling (your program) with benchmarking (often someone else’s program)—“every program is a snowflake” (speaker’s original imagery).


Structured Concurrency roadmap aside#
This section is off-topic at the podcast close—not part of the memory theme; API details follow the JEP.
Why#
Structured Concurrency binds child-task lifetimes to a parent scope, simplifying cancellation and error propagation. At recording time (JDK 26 had just shipped), Ron said the team originally planned to make it permanent in JDK 27 (speaker’s view).
Mechanism and constraints#
As of 2026-06-10, JEP 533 delivers the API as seventh Preview in JDK 27 (Completed means that JEP’s delivery is done, not API finalization); Summary text: preview once more in JDK 27. That conflicts with Ron’s podcast intent—trust the JEP. Prior rounds: JEP 480 (JDK 23 third), JEP 499 (JDK 24 fourth), JEP 525 (JDK 26 sixth). JEP 12 preview APIs are disabled by default.
How to#
javac --release 27 --enable-preview Main.java
java --enable-preview Main
import java.util.concurrent.StructuredTaskScope;

try (var scope = StructuredTaskScope.open(
        StructuredTaskScope.Configuration.newBuilder().build())) {
    var sub = scope.fork(() -> fetchData());
    scope.join();
    return sub.get();
}
Production use requires tracking JEP status; JDK 28+ may continue preview or eventually finalize (no Final JEP yet).
Common misconceptions#
- Writing “JDK 27 Structured Concurrency GA”—JEP 533 remains preview.
- Citing JEP 499 as “Third Preview”—the third round is JEP 480 (JDK 23).

References and further reading#
- Inside Java Podcast 59 — Java is Memory Efficient — episode home and summary; source for moving GC and RAM/CPU trade-off discussion
- JEP 248 — G1 default garbage collector (JDK 9) — starting point for server default moving path
- JEP 333 — ZGC experimental introduction (compacting/relocating) — ZGC moving semantics vs CMS without compaction
- JEP 377 — ZGC production features (JDK 15 GA) —
UseZGCandSoftMaxHeapSize - JEP 351 — ZGC return unused heap memory — ZUncommit and
-Xms/-Xmxconstraints - JEP 363 — Remove CMS (JDK 14) — CMS migration and flag-ignore behavior
- JEP 523 — G1 default for all environments (JDK 27) — default GC extension for small-memory scenarios
- JEP 533 — Structured Concurrency seventh Preview — JDK 27 API status (not GA)
- Appel 1987 — GC can be faster than stack allocation — early moving-collector theory
- HotSpot TLAB source — thread-local bump allocation mechanism
- Go GC Guide — non-moving mark-sweep — official cross-language non-moving path description
- JMH project README — micro-benchmark project isolation and pitfalls
- java(1) manual — Flight Recorder startup options — reproducible
-XX:StartFlightRecordingcommands - jcmd(1) manual — JFR.dump — dump recording while running
- SIGPLAN — International Symposium on Memory Management — correct memory-management workshop entry (not ismm.org)